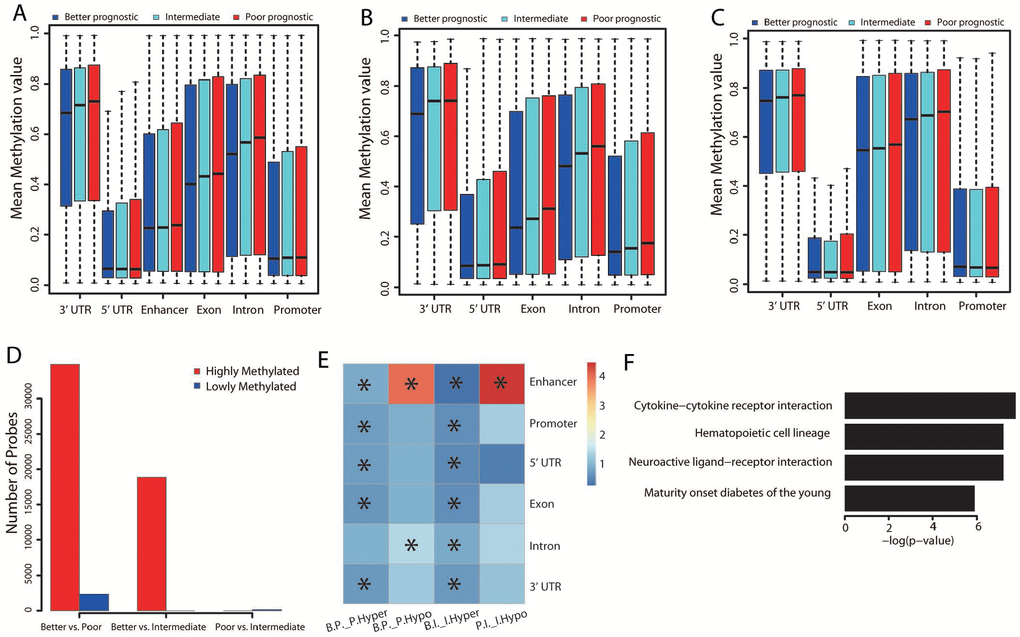
Figure 5.Methylation differences among the three groups. (A) Distribution of the mean beta values of probes across different genomic regions. The mean beta values of probes annotated to genes that were upregulated (B) or downregulated (C) in the better prognostic group versus the poorer prognostic group across different genomic regions are also shown. (D) Distribution of numbers of significantly methylated probes for each group comparison. (E) Genomic region enrichment of differentially methylated probes. We calculated the number of differentially methylated probes, along with the total number of probes on the bead array in each genomic region. Fisher’s exact test was used to test the enrichment. The heatmap displays the odds ratio, and the asterisks mark the significance (adjusted P value ≤ 0.001). “B.P._P.Hyper”: hypermethylated probes in the poorer versus the better prognostic group; “B.P._P.Hypo”: hypomethylated probes in the poorer versus the better prognostic group; “B.I._I.Hyper”: hypermethylated probes in the intermediate versus the better prognostic group; “P.I._I.Hypo”: hypomethylated probes in the intermediate versus the poorer prognostic group. (F) Significantly (adjusted P value < 0.01) enriched pathways of the hypomethylated genes in the better versus the poorer prognostic group.