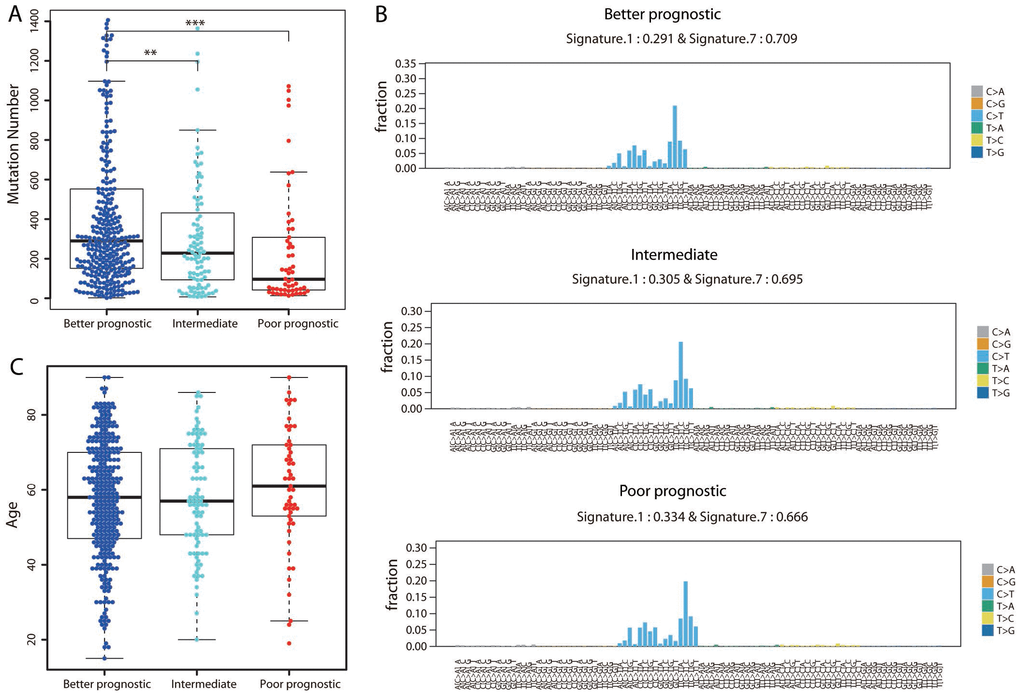
Figure 6.Assessment of mutational differences among the three groups. (A) The total number of nonsynonymous mutations is shown for each group. The P value was calculated by a two-sided Student’s t test. **P < 0.01; ***P < 0.001. (B) The 96-trinucleotide mutational spectra of mutations in the better (top panel), intermediate (middle panel) and poorer (bottom panel) prognostic groups were inferred by deconstructSigs. The fraction of mutations found in each trinucleotide context is displayed. Mutational Signatures 1 (associated with age) and 7 (associated with ultraviolet light exposure), together with the weights contributing to each group, are shown above each figure. (C) Distribution of ages in the three groups.