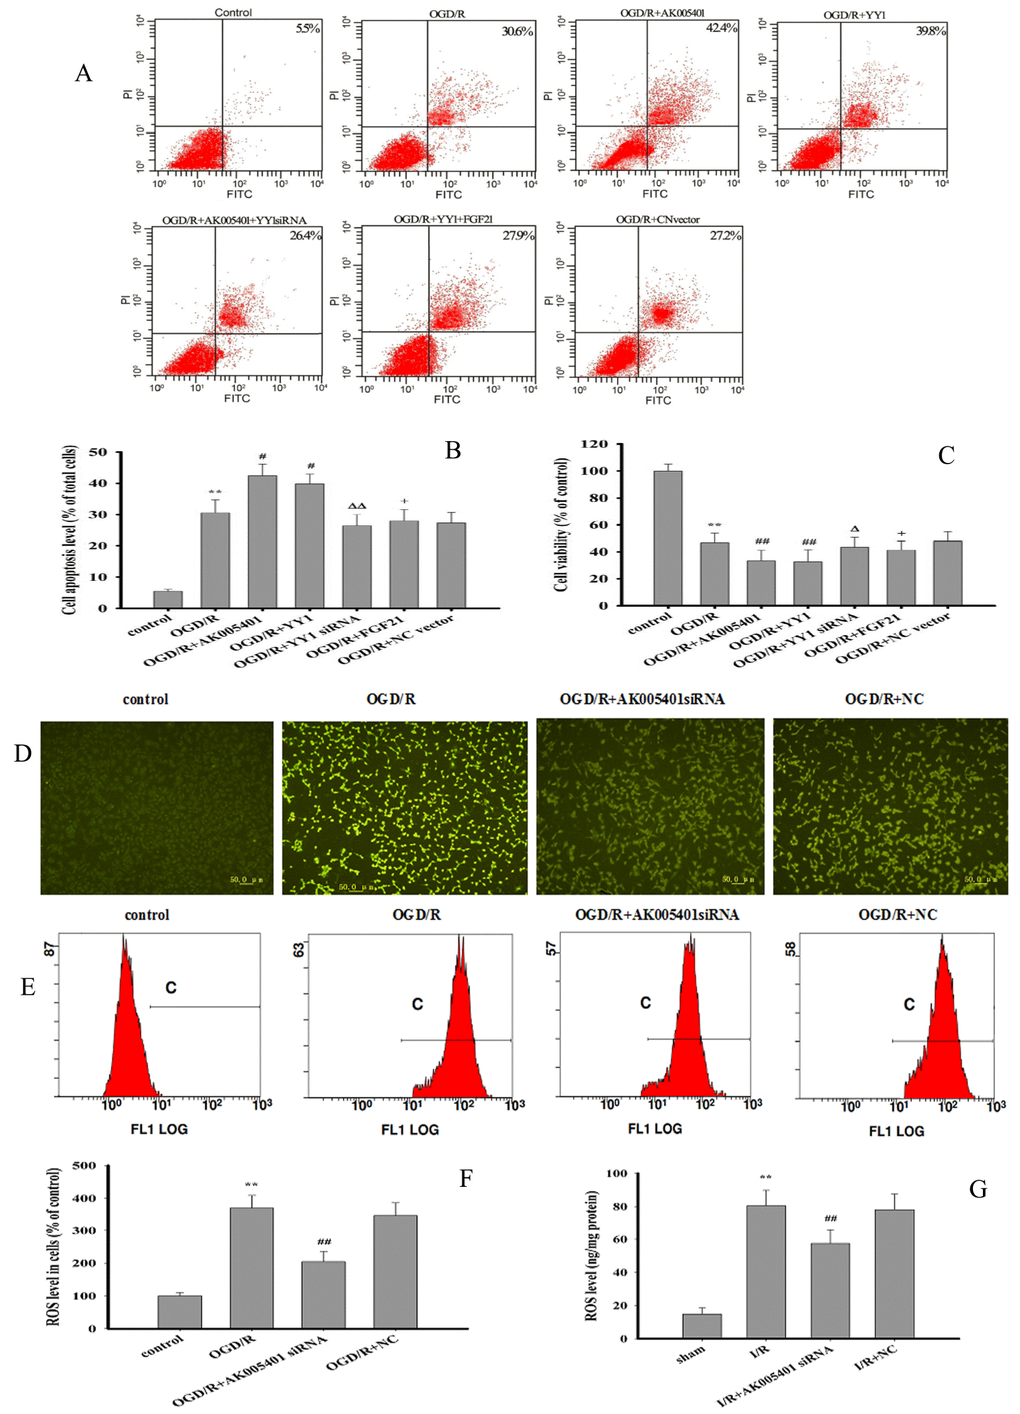
Figure 4.Effect of overexpression of AK005401and YY1 on cell viability and apoptosis and effect of AK005401 on ROS generation. Mice and HT22 cells were used to establish I/R model and OGD/R model, respectively. Cells were collected and seeded in a 96-well plate or 6-well plate and divided into seven groups as follows: control, OGD/R, OGD/R+AK005401 (OGD/R+ AK005401 overexpression vector), OGD/R+YY1 siRNA (OGD/R + AK005401 overexpression vector +YY1 siRNA), OGD/R+YY1 (OGD/R+ YY1 overexpression vector), OGD/R+FGF21 (OGD/R + YY1 overexpression vector +FGF21 overexpression vector) and OGD/R+NC vector(OGD/R+ negative control vector) groups. (A) Cell activities were evaluated using AnnexinV/PI apoptosis assay kit. (B) Apoptotic cells obtained from AnnexinV/PI method were counted as a percentage of the total number of cells. (C) Cell viability was detected by MTT method. ROS levels in all groups were detected using fluorescent microscope and flow cytometry. (D) ROS levels were observed using fluorescent microscope after treatment with DCFH-DA. (E) ROS production was analyzed by applying flow cytometry. (F) Effects of AK005401 on ROS levels in HT22 cells (n = 3 experiments). (G) the ROS contents in hippocampus tissues were measured at 450 nm according to the procedures described by ROS ELISA assay kits. Data were presented as mean±SD (n = 10 in hippocampus tissues, or n = 3 in cells). One-way ANOVA test was used to determine statistical significance. **P < 0.01 vs. sham group or control group, #P < 0.05 or ##P < 0.01 vs. I/R group or OGD/R group, ΔP < 0.05 or ΔΔP < 0.01 vs.OGD/R+AK005401 group, +P < 0.05 vs.OGD/R+YY1 group.