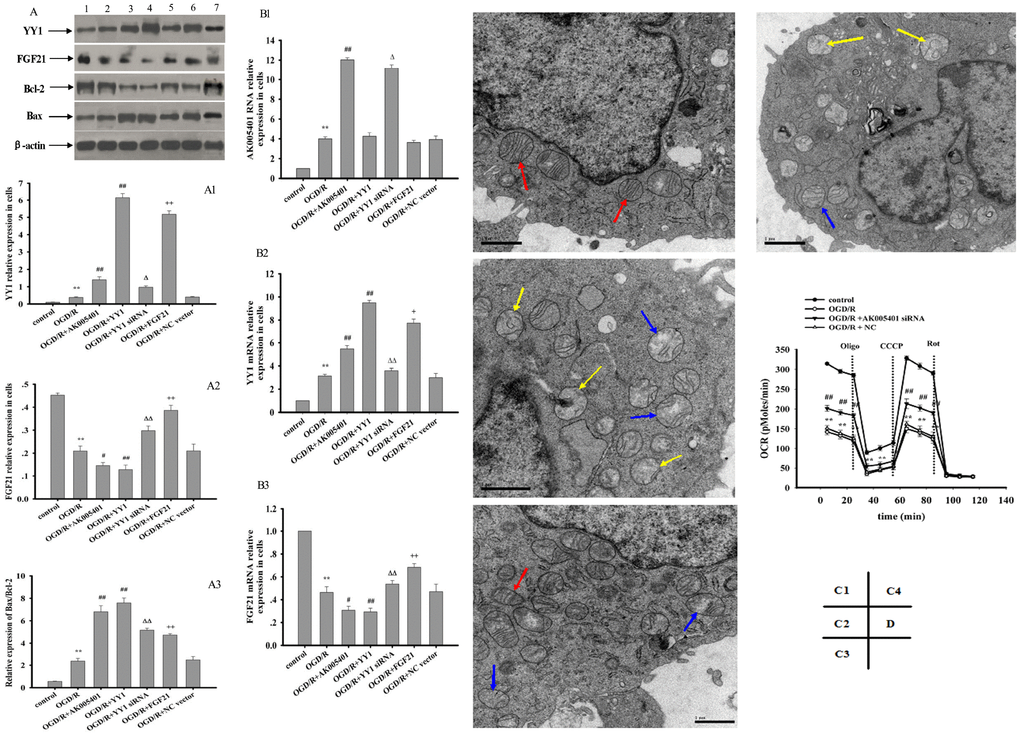
Figure 7.Effect of overexpression of AK005401 and YY1 on the expressions of target genes and proteins and effect of AK005401 on mitochondrial structure and cell respiration. HT22 cells were seeded in 96-well and 6-well plates and divided in seven groups for expression of target genes and proteins (control, OGD/R, OGD/R+AK005401, OGD/R+YY1, OGD/R+YY1 siRNA, OGD/R+FGF21 and OGD/R+NC vector) or four groups for cell respiration (control, OGD/R, AK005401siRNA, and NC). A represents Western blots in panel (1, 2, 3, 4,5,6 and 7 represent control, OGD/R, OGD/R+AK005401, OGD/R+YY1, OGD/R+YY1 siRNA, OGD/R+FGF21 and OGD/R+NC vector, respectively). (A1–A3) represent the relative expressions of YY1, FGF21and the relative ratio of Bax/Bcl-2 in cells, respectively. (B1–B3) represent represent the expression levels of AK005401, YY1 and FGF21 in HT22 cells, respectively. (C1–C4) represent mitochondria structure of control group, OGD/R group, AK005401siRNA group, and NC group, respectively, by using a transmission electron microscope (×20,000 magnification). Transmission electron microscope shows normal mitochondrial structure (red solid line arrows) and pathological mitochondria with irregular shape, as well as swollen (blue solid line arrow) and vesicular mitochondrial clusters (yellow solid line arrow). (D) represents mitochondrial oxygen consumption rate (OCR) of different groups. OCR was measured using an Oxygraph-2k system (n = 3 experiments per condition). Data were presented as mean±SD (n = 3). One-way ANOVA test was used to determine statistical significance. **P < 0.01 vs. control group, #P < 0.05 or ##P < 0.01 vs. OGD/R group, ΔP < 0.05 or ΔΔP < 0.01 vs.OGD/R+AK005401 group, +P < 0.05 or ++P < 0.01 vs.OGD/R+YY1 group