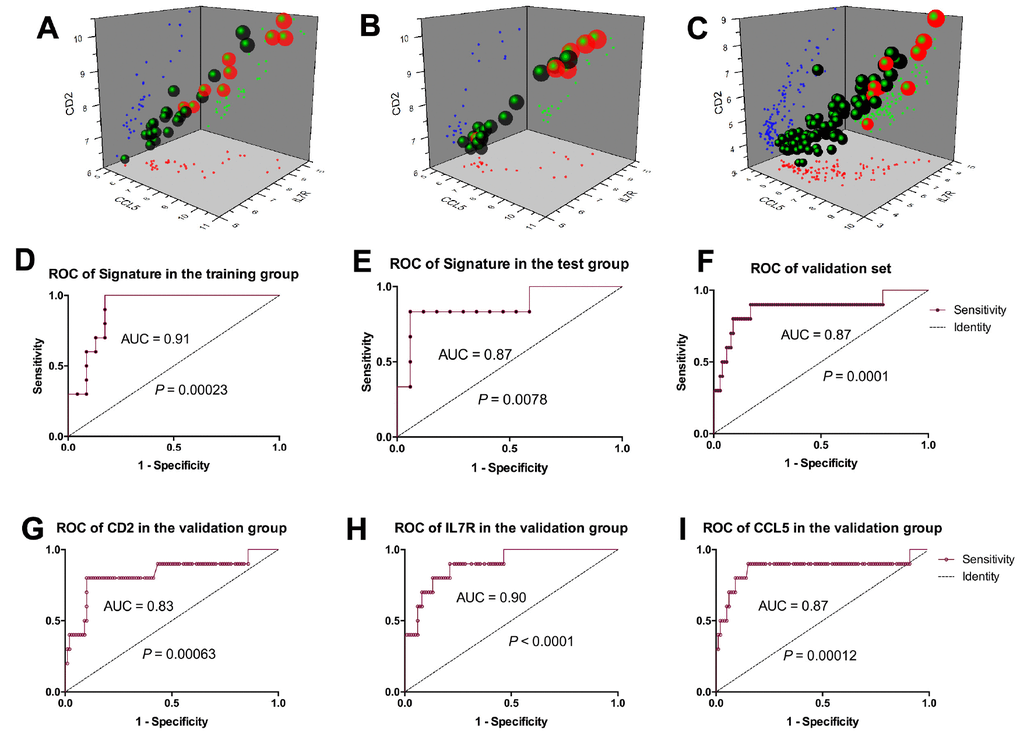
Figure 4.Prognostic model establishment based on the 3-gene signature. Scatter diagram of the training group. (A), test group (B), and validation group (C) showed the subjects with higher prognostic scores showed a tendency towards the expression of high-risk genes. ROC curves of the training group, test group and validation group were respectively 0.91(D), 0.87 (E) and 0.87 (F); ROC curves of CD2, IL7R and CCL5 were respectively 0.83 (G), 0.9 (H) and 0.87 (I).