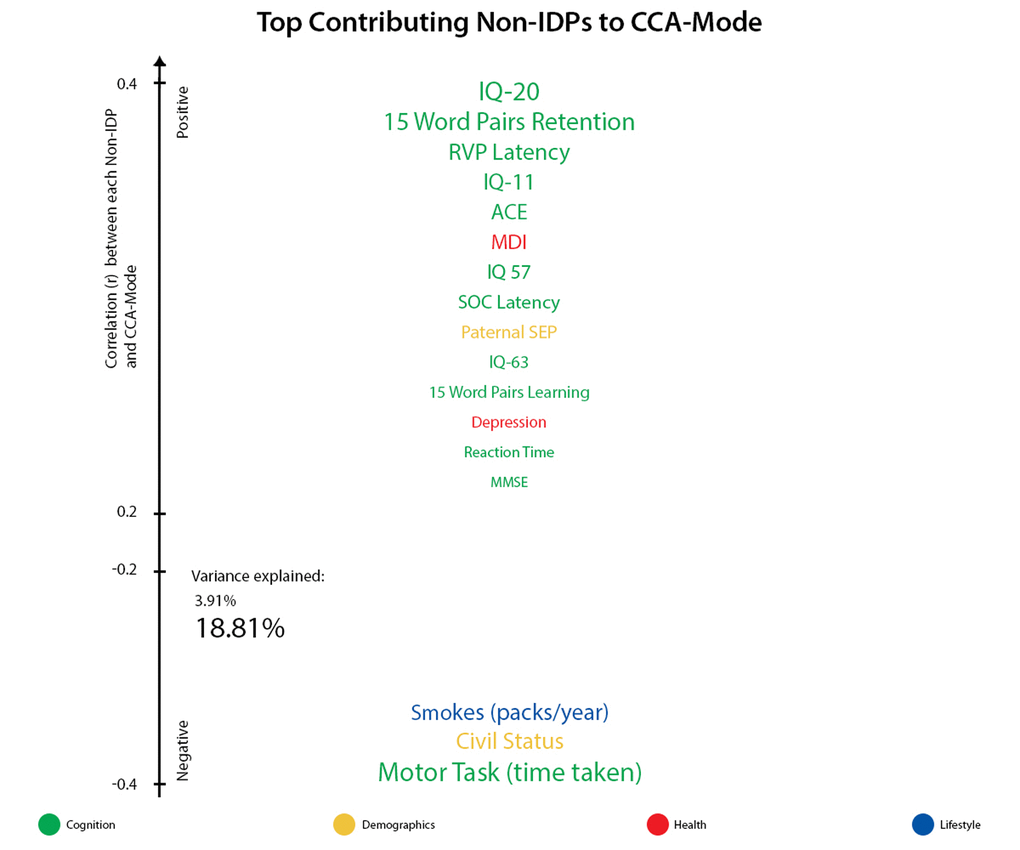
Figure 3A.Top contributing non-IDP variables to CCA-mode. Individual non-IDP measures most strongly associated with the identified CCA-mode of population covariation. The CCA-derived weights visualized indicate how much each measured variable contributes to the significant CCA-mode i.e., the measure of the strength of involvement of an observed variable to the CCA-mode. Non-IDPs are colored according to their assigned subdomains (cognition = green, demographic = yellow, health = red, lifestyle = blue). The vertical position of each variable is related to the scale of the association of that specific measure with the identified CCA-mode. Font size is indicative of variance explained by the CCA-mode. Here we do not report variables that attain a correlation value between 0.2 to -0.2.