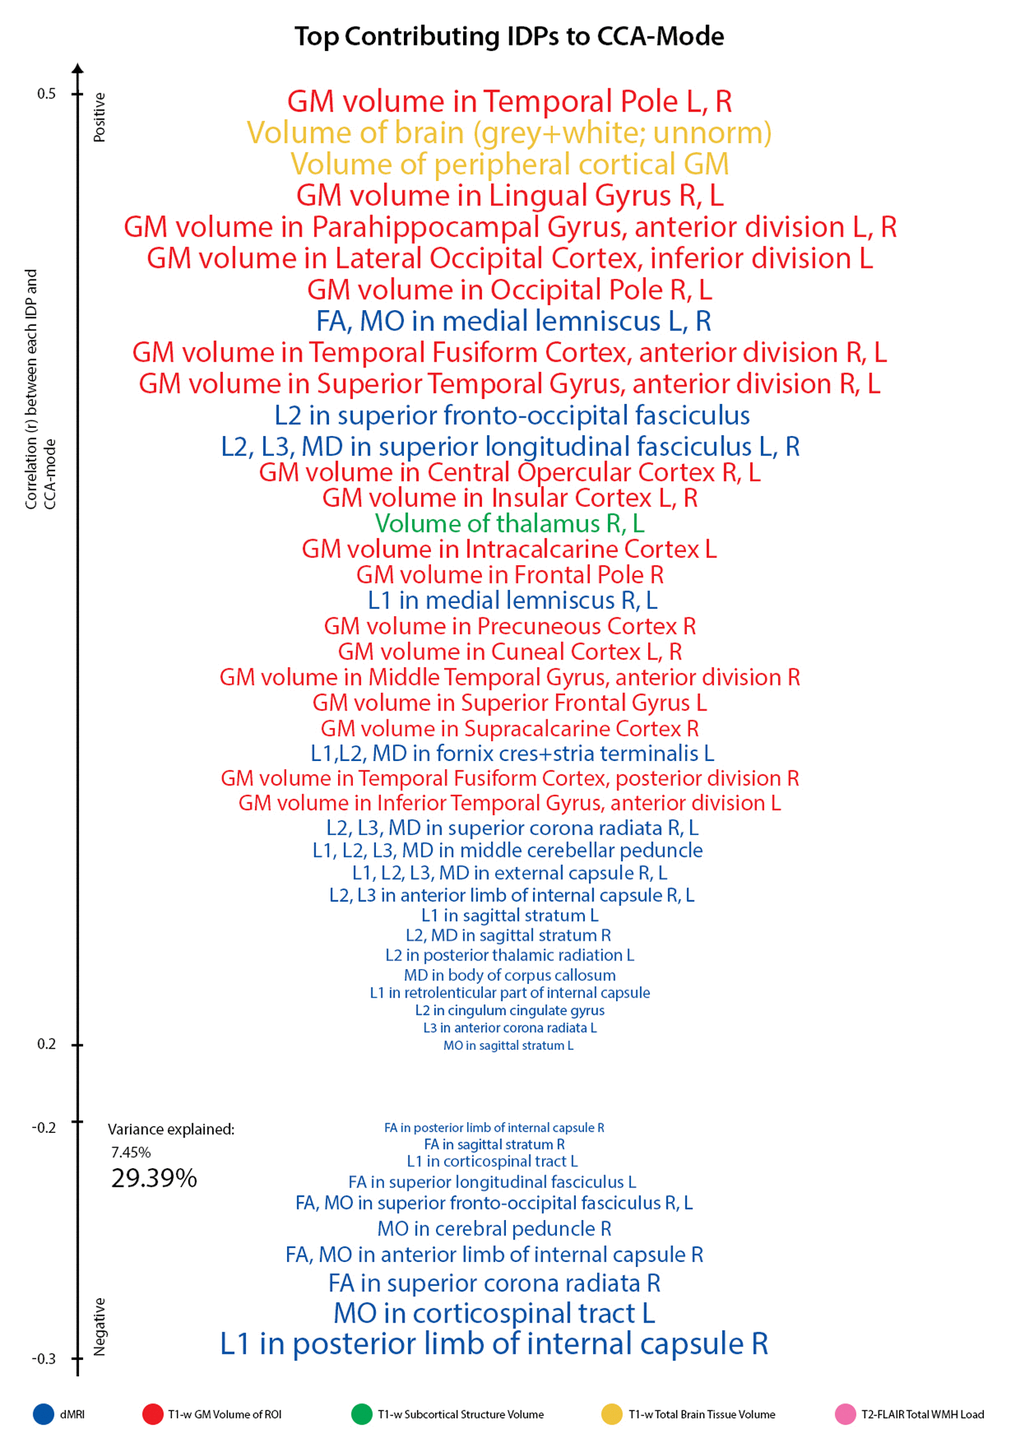
Figure 3B.Top contributing IDP variables to CCA-mode. Individual IDP measures most strongly associated with the CCA-mode of population covariation. The CCA-derived weights visualized indicate how much each measured variable contributes to the significant CCA-mode i.e., the measure of the strength of involvement of an observed variable to the CCA-mode. IDPs are colored according to their assigned subdomains: dMRI-TBSS = blue, T1w-FAST total grey matter volume within grey matter region-of-interests = red, T1w-FIRST subcortical structure volumes = green, T1w-SIENAX total brain tissue volume = yellow, T2w-FLAIR-BIANCA total volume of white matter hyperintensities = pink. The vertical position of each variable is related to the scale of the association of that specific measure with the identified CCA-mode. Font size is indicative of variance explained by the CCA-mode. Here we do not report variables that attain a correlation value between 0.2 to -0.2. (Abbreviations: L = left, R = right, FA = fractional anisotropy, L1 = 1st eigenvalue, L2 = 2nd eigenvalue, L3, = 3rd eigenvalue, MD = mean diffusivity, MO = tensor mode).