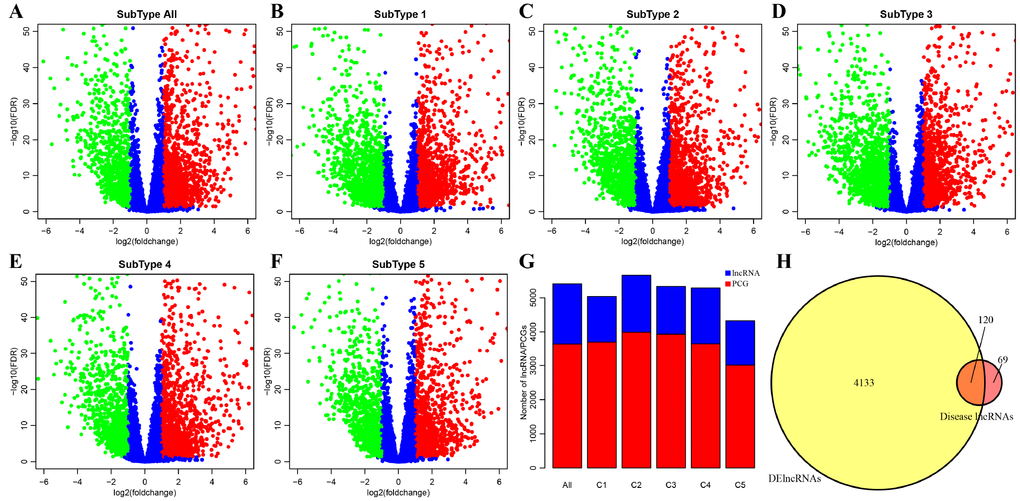
Figure 2.Identification of key differentially expressed protein-coding genes and lncRNAs among five subtypes. (A) Volcano plot shows the differential expression pattern of lncRNAs between tumors and adjacent normal tissues (named “subtype all”). The upregulated genes are shown as red and the downregulated genes are shown as green. (B–F) The up-(red) and down-(green) regulated lncRNAs across five molecular subtypes (subtype 1, 2, 3, 4, 5) are also shown as volcano plots, respectively. (G) Distribution of DE-lncRNAs and DE-PCGs among five subtypes (C1, C2, C3, C4, C5) and tumors and adjacent normal tissues (named “subtype all”) are shown. LncRNAs are presented as blue and PCGs are shown as red. (H) Venn diagram displays the intersection of DE-lncRNAs and Disease lncRNAs. Total 120 overlapped lncRNAs are indicated. Remaining 69 disease lncRNAs are excluded in our research.