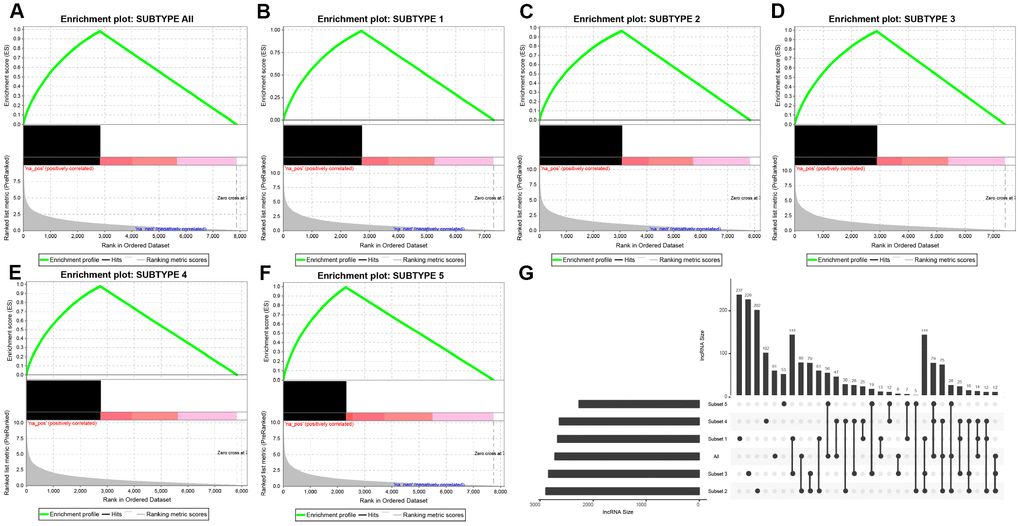
Figure 3.Distribution condition of DE-lncRNAs in subtypes. (A–F) GSEA analysis shows different enrichment states among these five subtypes (subtype 1, 2, 3, 4, 5) and tumors and adjacent normal tissues (named “subtype all”) based on difference multiple. The enriched lncRNAs are mainly focused on the left (presented as black bulks), which referring to larger difference multiple. (G) The overlapped lncRNAs exist in subtypes. The dot represents subtype and the line represents the overlapped lncRNAs across subtypes. LncRNA size points to the amount of DE-lncRNAs.