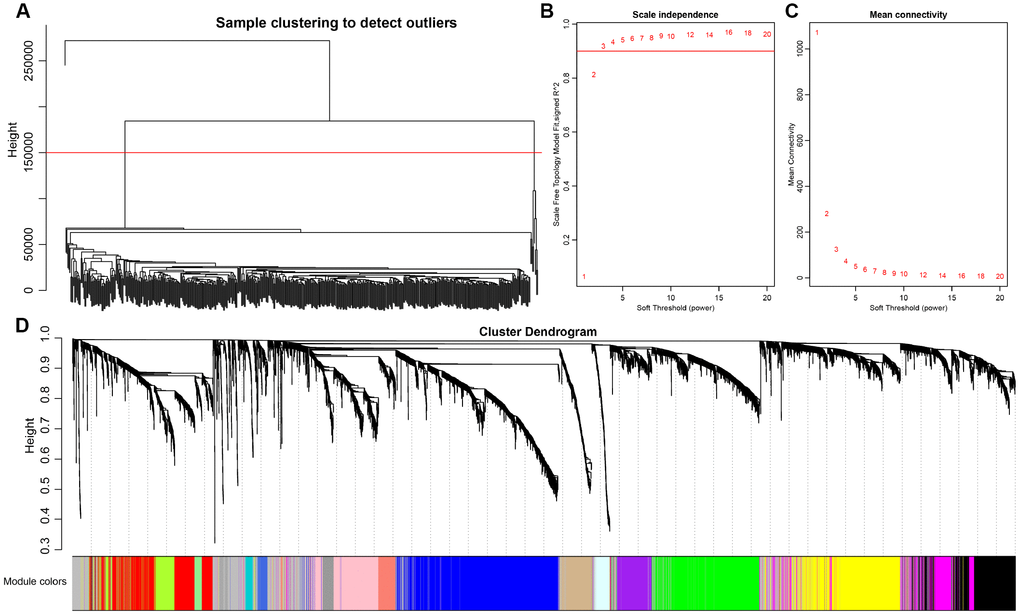
Figure 4.Weighted gene co-expression network analysis (WGCNA) to identify clinical modules. (A) Hierarchical clustering is applied to exclude some outliers samples. Objects with height greater than 150000 (upper the red line) are excluded. (B–C) Analysis of network topology for soft thresholding powers. The red line represents the square of correlation coefficient reaches to 0.9. The mean connectivity under different values of ‘power’ are shown. (D) Modules dendrogram of samples and modules are indicated by different colors.