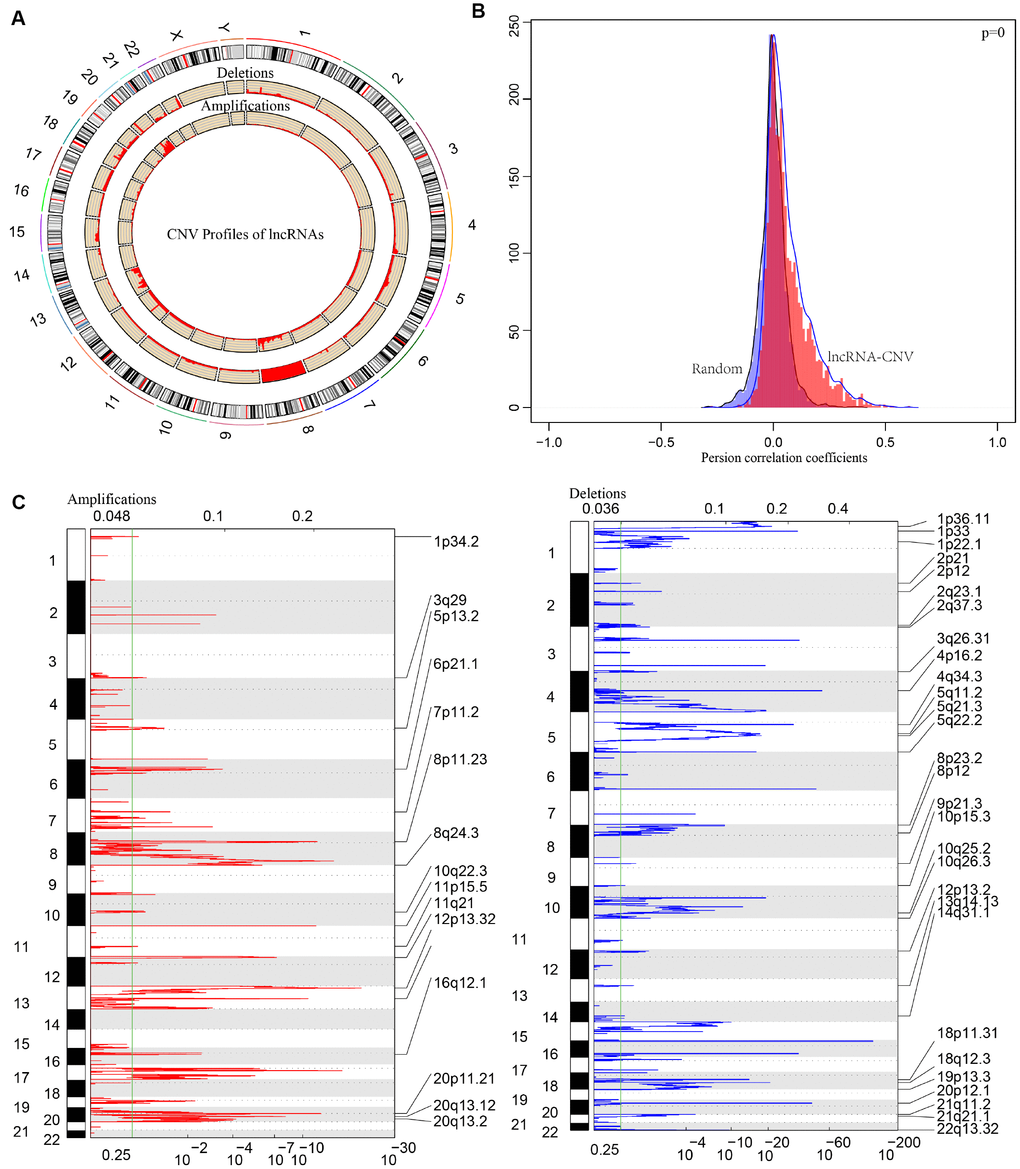
Figure 7.The pattern of CNVs profiles in the whole genomes. (A) The proportional frequencies of copy number deletions or amplifications of lncRNAs existing in the whole genome. CNV deletions of lncRNAs are mainly concentrated on 8 chromosome, and amplifications are focused on 8, 13, 20 chromosomes. The frequency of deletions are largely general than amplifications. (B) Distribution of correlation coefficient between copy number alternations of lncRNAs and the expression level of lncRNAs is shown. The correlation coefficient of CNV-lncRNA greater than 0 represents the regulation relationship is positive. (C) LncRNAs located in the focal peaks are CRC-related. False-discovery rates (q values) and scores from GISTIC 2.0 for alterations are plotted in x-axis, and the genome positions are shown as y-axis; dotted lines indicate the centromeres (distinguishing chromosome long arm from short arm). Amplifications (left, red) and deletions (right, blue) of lncRNAs are also shown. The green line represents 0.25 q value cut-off point that determines significance.