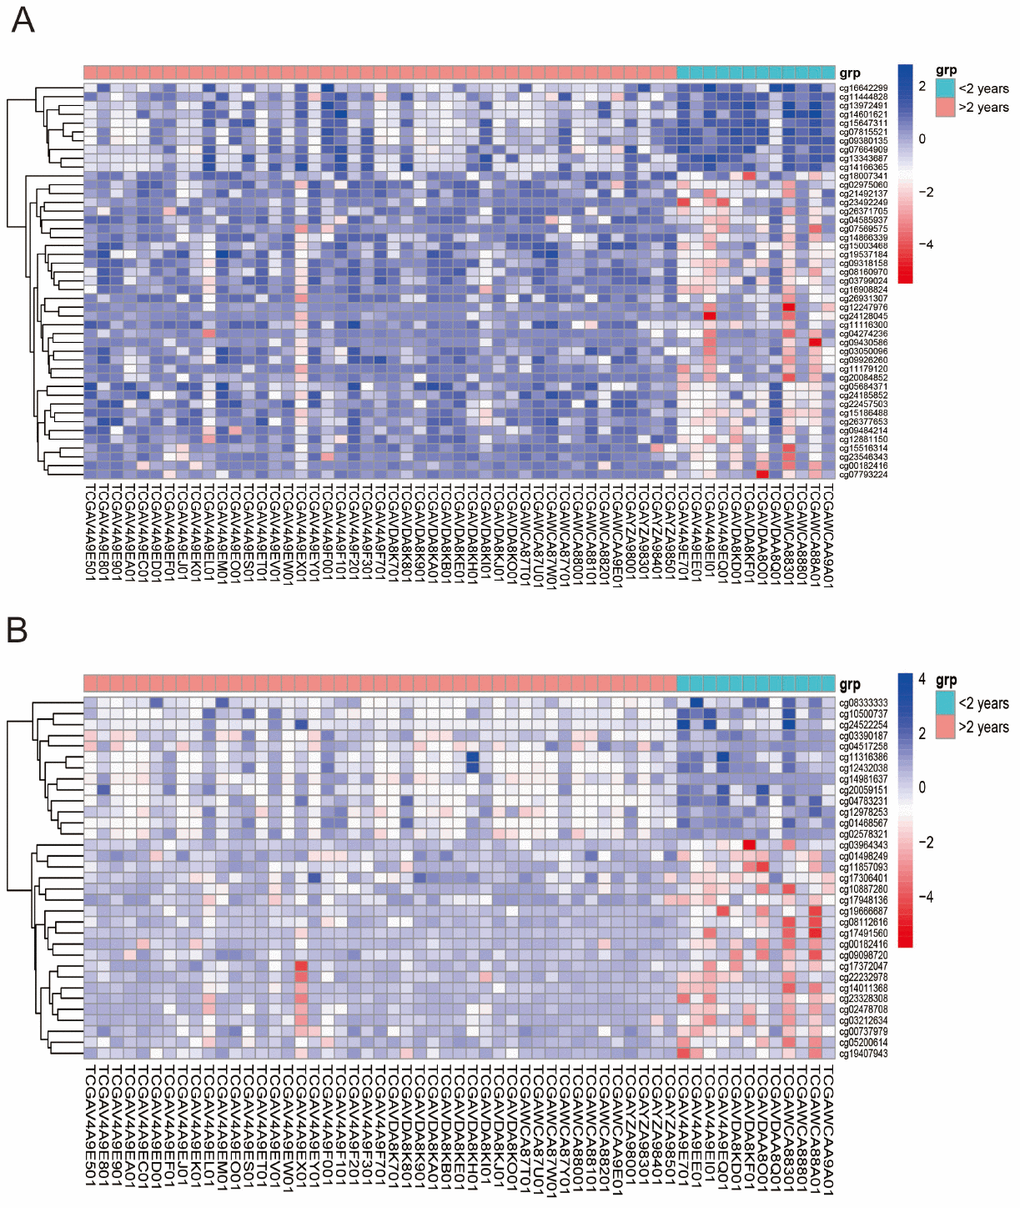
Figure 2.Unsupervised hierarchical cluster in the analysis of differentially methylated miRNAs target genes (A) and genes co-expressing with lncRNAs (B) in UVMs Alive < 2 years group relative to Alive > 2 years group control. Values from samples are presented horizontally, left (red) for Alive > 2 years patients while the right (green) for Alive < 2 years patients. CpG sites of miRNAs and lncRNAs are listed vertically. Blue and red represent levels of hypomethylation and hypermethylation, respectively, while white indicates methylation was not detected.