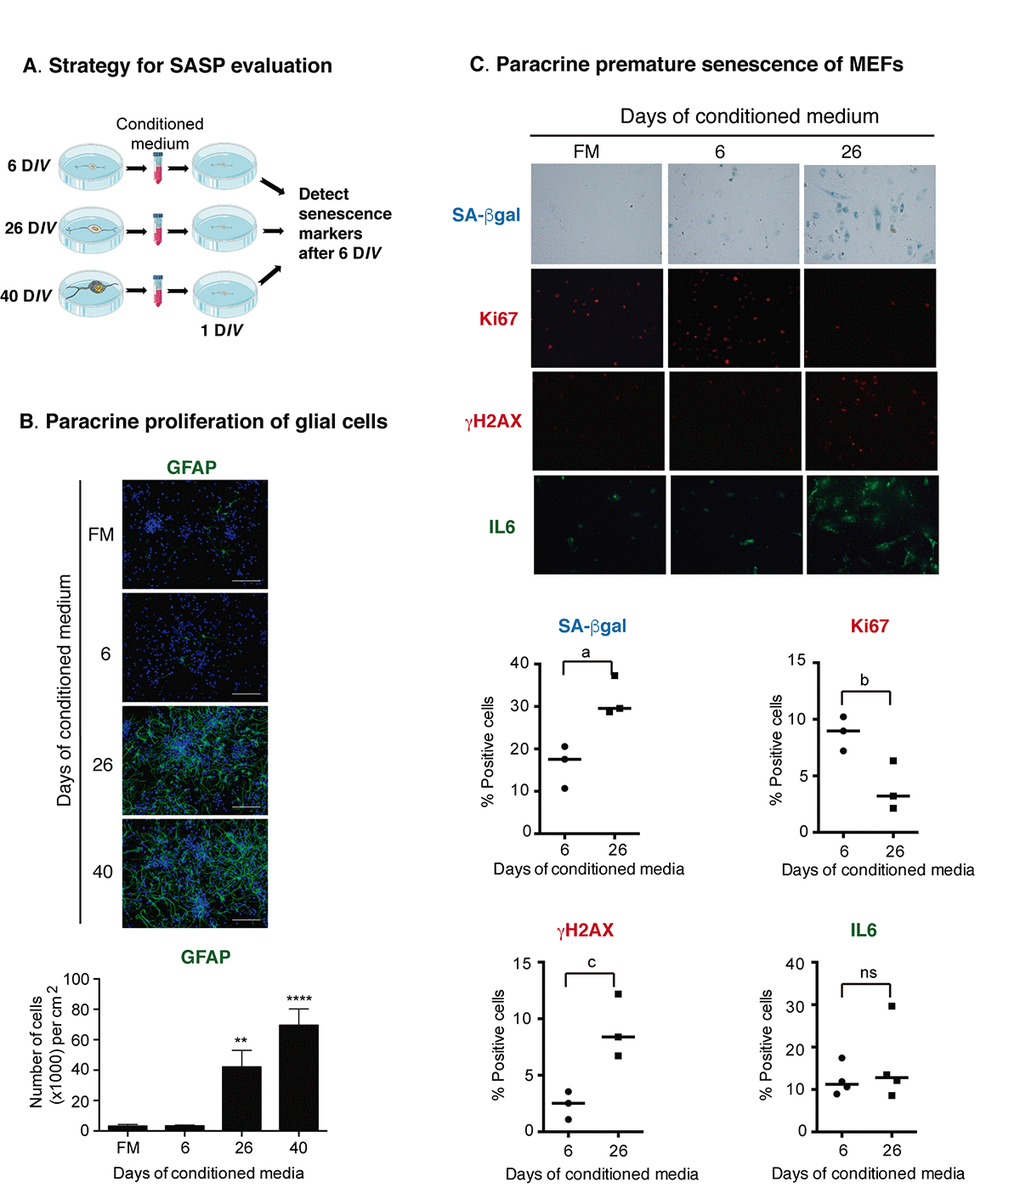
Figure 6.Senescent cortical cells develop a functional SASP. (A) Experimental design to evaluate the presence of secreted molecules with SASP activity from senescent cortical cells. Conditioned media was collected from cortical cells that had been incubated from 1-6 (6), 19-26 (26) or 32-40 (40) DIV. Either primary prenatal cortical cells or MEFs were cultured for 24 hr (1 DIV) before adding conditioned media; senescence markers were evaluated 6 days later. (B) Conditioned media from senescent cortical cells induced paracrine proliferation of glial cells in primary culture of prenatal cortical cells. Representative immunofluorescences to detect GFAP in cortical cells are shown. Cells were incubated with conditioned media collected from cortical cells that had been incubated during the indicated DIV. FM stands for fresh medium. Notice that conditioned media from 26 DIV and 40 DIV induced high proliferation of glial cells. Scale bars represent 500 μm. The bottom graph is a quantification of the number of GFAP expressing cells in three independent experiments, each done in duplicate. Data were analyzed by one-way ANOVA, with Dunnett´s multiple comparison test. ** p<0.01; ****p<0.0001 compared to FM. (C) Conditioned media from senescent cortical cells induced paracrine premature senescence in MEFs. MEFs were incubated with conditioned media collected from cortical cells that had been incubated during the indicated DIV. FM stands for fresh medium. Notice that senescent markers were higher in cells incubated with conditioned media from cortical cells cultured for 26 days. The bottom graphs are quantifications of the percentage of cells with blue or fluorescent signals. The signal (either blue or fluorescent) from cells incubated with 6 DIV conditioned media plus one standard deviation was deducted from the signal obtained from the cells treated with 26 DIV conditioned media. Three independent experiments, each performed in duplicate were quantified. Data were analyzed by unpaired T test. a, p=0.0175; b, p=.0.0327; c, p=0.0191.