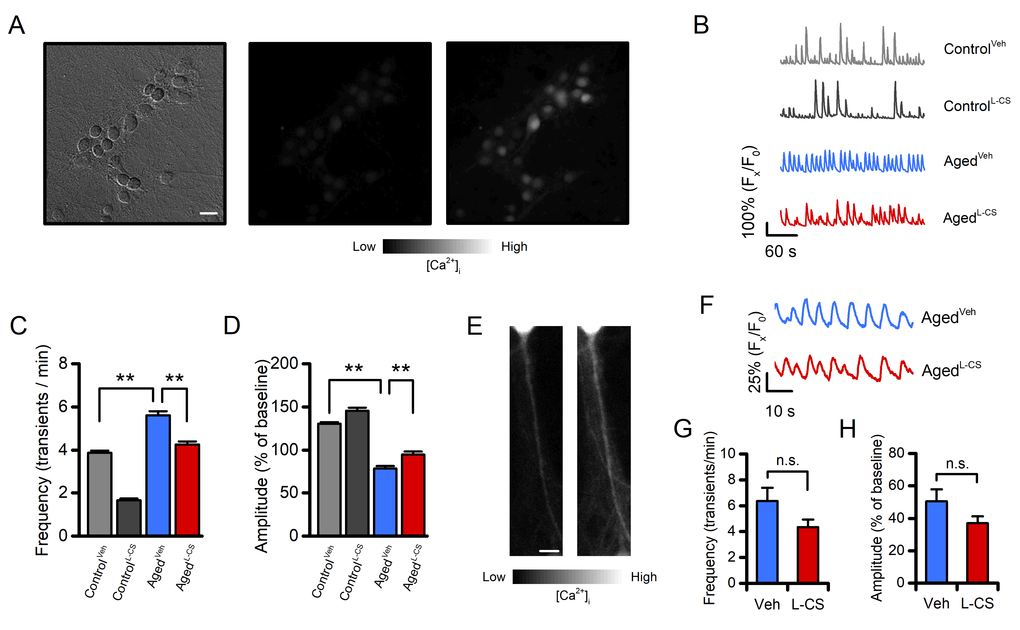
Figure 4.Effects of aging and L-CS on Ca2+transient frequency and amplitude.(A) Representative brightfield (left) and fluorescent (middle and right) micrographs of a fluo-4-loaded agedL-CSneuronal culture employed to monitor spontaneous Ca2+transients (scale bar 25 µm). Greyscale fluorescent images show cortical neurons before (middle) and during (right) a Ca2+transient. (B) Time course of somatic spontaneous Ca2+oscillations in the four study groups. Each trace depicts a single neuron representative of at least three independent experiments. (C) Bar graphs depict average transient frequencies of vehicle- or L-CS-treated control and aged neurons (ControlVeh: n=499, ControlL-CSn=253, AgedVehn=367, and AgedL-CSn=293 cells obtained from 15-38 experiments). (D) Bar graphs depict the average Ca2+transient amplitude in the four study groups [samples are the same as in (C)]. (E) Representative greyscale fluorescent micrographs of a fluo-4-loaded primary dendrite before (left) and during (right) a Ca2+transient. (F) Time course of dendritic spontaneous Ca2+oscillations in the AgedVehand AgedL-CScultured neurons. Each trace depicts a single dendrite representative of at least three independent experiments. (G) Bar graphs depict average transient frequencies of AgedVehand AgedL-CSdendrites (AgedVehn=21 and AgedL-CSn=27 dendrites from 12-18 experiments). (H) Bar graphs depict the average dendritic Ca2+transient amplitude in the four study groups [samples are the same as in (G)]. In C and D means were compared by two-way ANOVA followed by Tukey post-hoc test. In G and H means were compared by unpaired Student t-test. ** indicates p<0.01, n.s. indicates not significant.