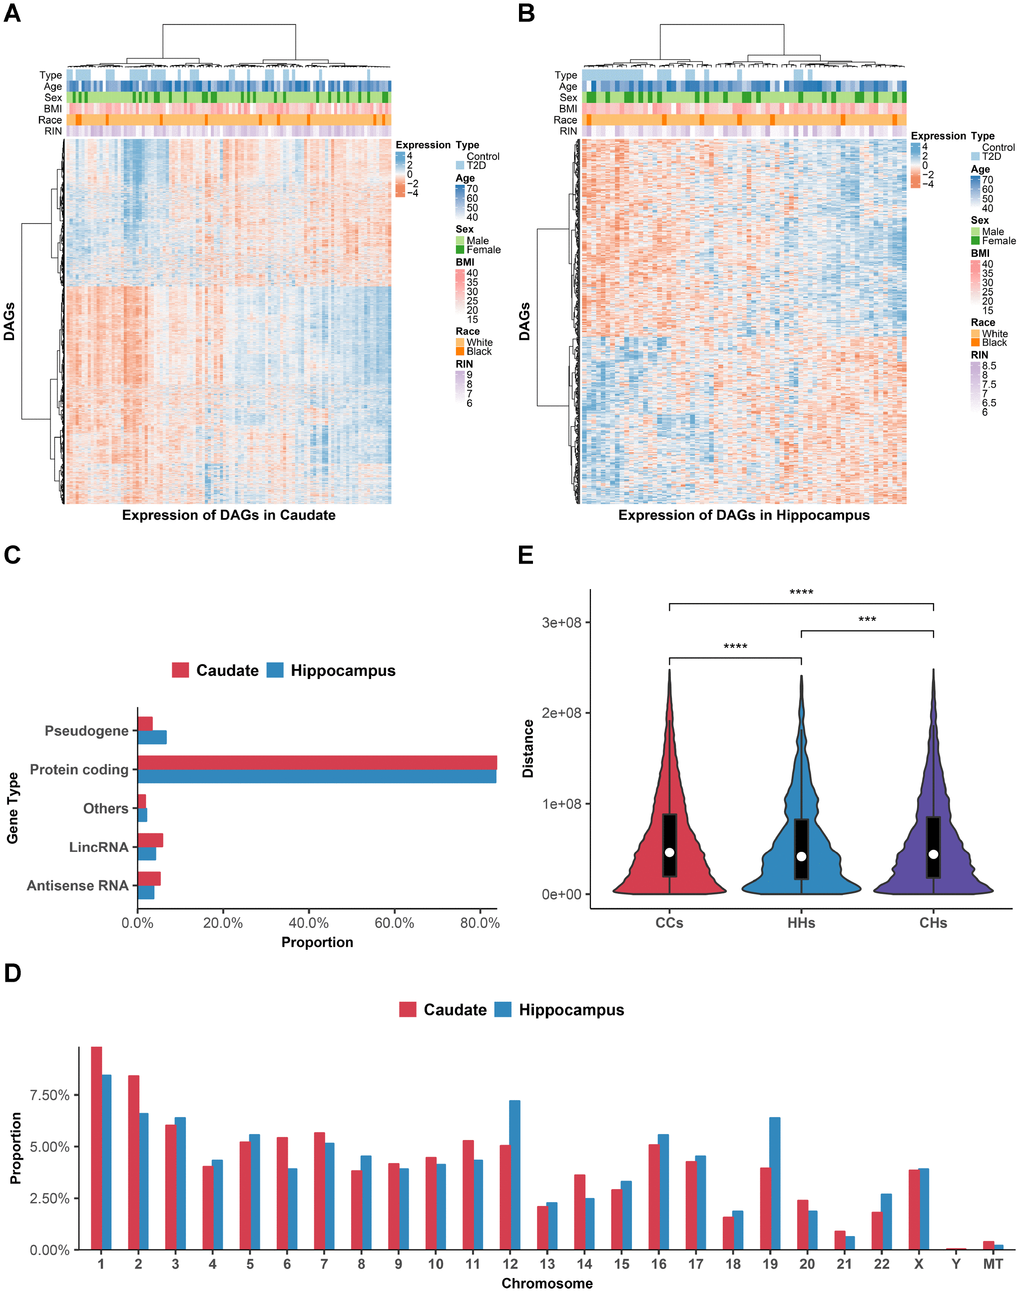
Figure 2.Distributions of DAGs. (A and B) Heat maps of DAGs (row) on samples (column) were shown for caudate (A) and hippocampus (B). (C) Gene biotype categories of DAGs according to GENCODE. X-axis shows the proportion to the total DAGs in each brain region. (D) Chromosomal distribution of DAGs. Y-axis shows the proportion to the total DAGs in each brain region. (E) The violin plot comparing the intra-chromosomal distances between DAGs in different brain regions. ***P < 0.001; ****P < 0.0001, Wilcoxon’s test. CCs, distance of DAGs within caudate group; HHs, distance of DAGs within hippocampus group; CHs, distance of DAGs between caudate and hippocampus group.