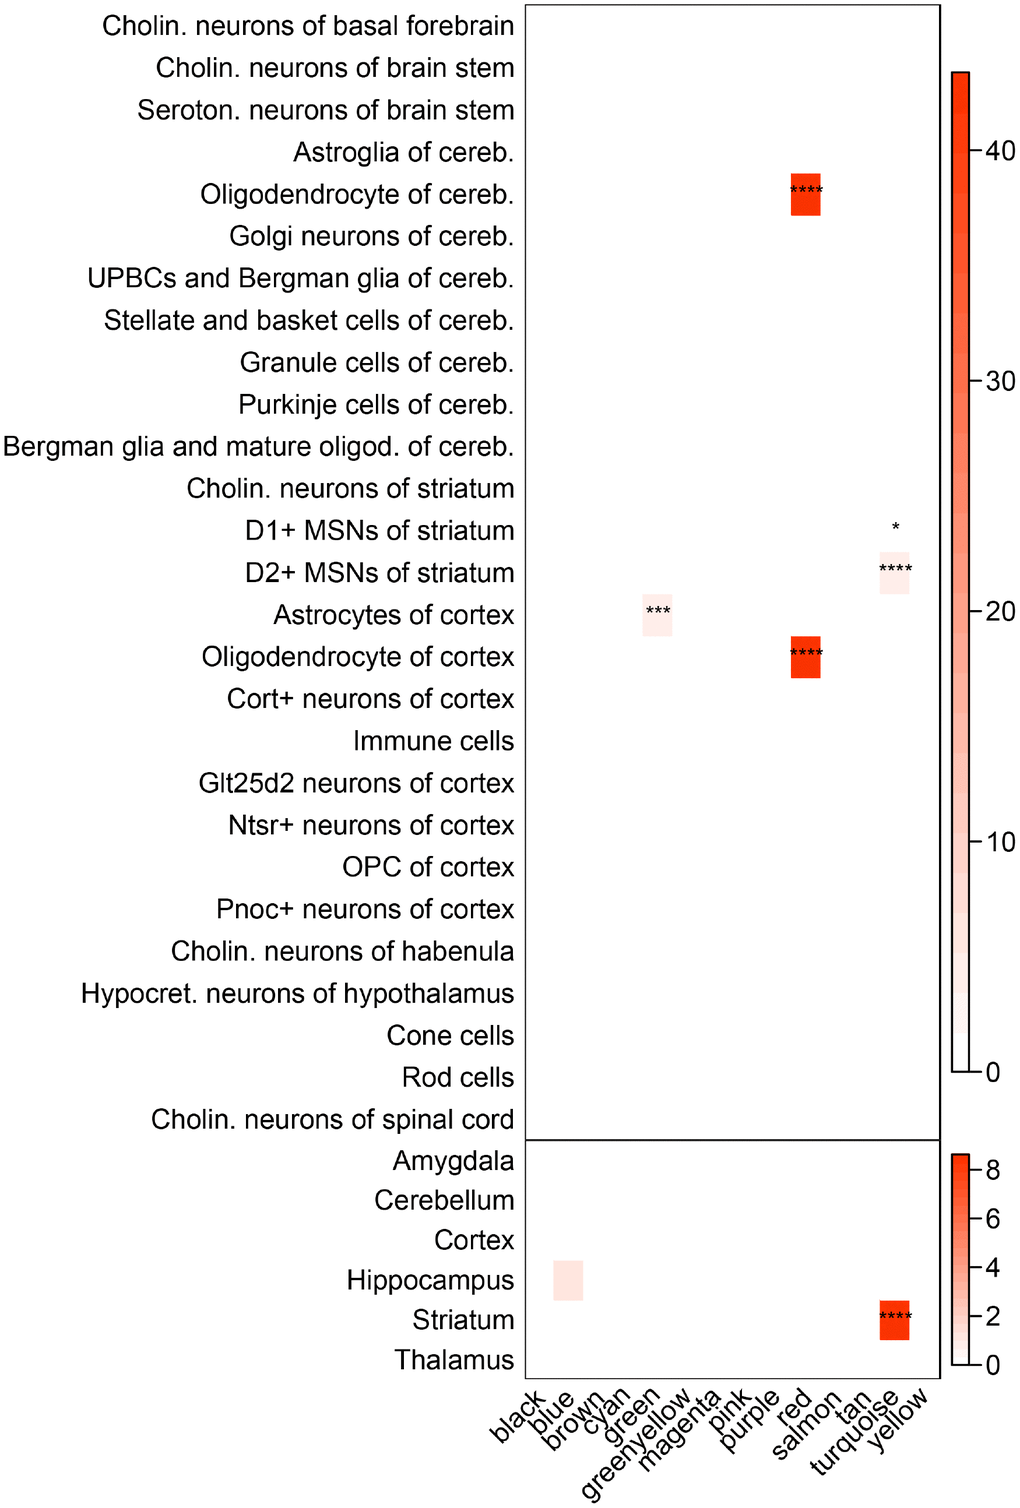
Figure 4.Enrichment of brain regional and cell-type markers in caudate modules. (Top) Enrichment of caudate modules in markers of various neuronal and glial cell types. (Bottom) Same as above, but using markers for different brain regions. Asterisks indicate significant enrichment after Bonferroni adjustment. *P < 0.05; **P < 0.01; ***P < 0.001; ****P < 0.0001, Fisher’s Exact test. Cholin., cholinergic; seroton., serotonergic; cereb., cerebellum; UPBCs, unipolar brush cells; oligod., oligodendrocyte; MSNs, medium spiny neurons; hypocret., hypocretinergic.