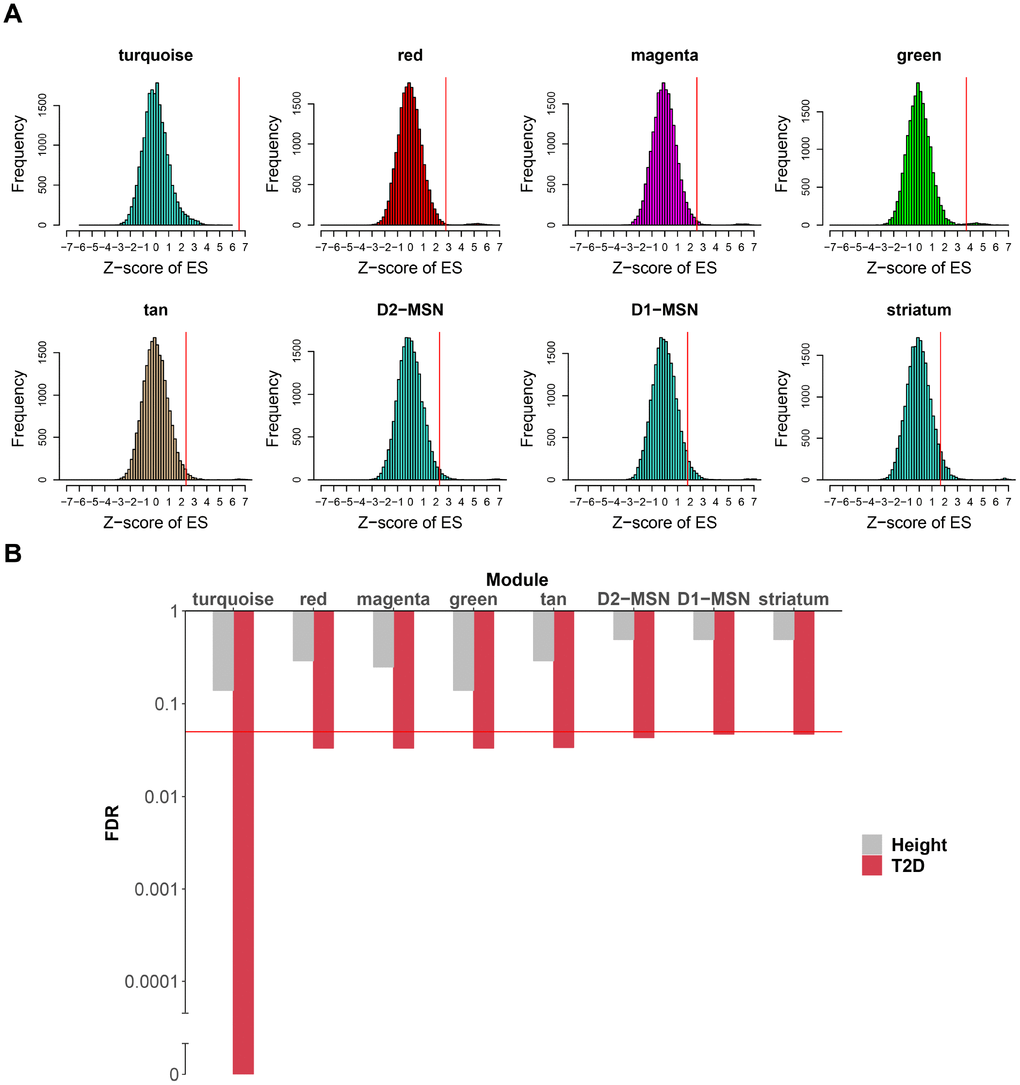
Figure 5.Caudate modules enriched in T2D genetic signals. (A) For each module (or sub-module), the null distribution of T2D SNPs enrichment scores generated by 20,000 random permutations is shown. Real enrichment scores were depicted by red vertical lines. Modules were considered significant if FDR < 0.05. (B) For each module in (A), enrichment FDR for T2D SNPs are shown by histogram compared to height SNPs. Y-axis was log10 transformed and broken axis was used to show zero value. The red horizontal line marks the FDR threshold for significance, which is 0.05. FDR, false discovery rate.