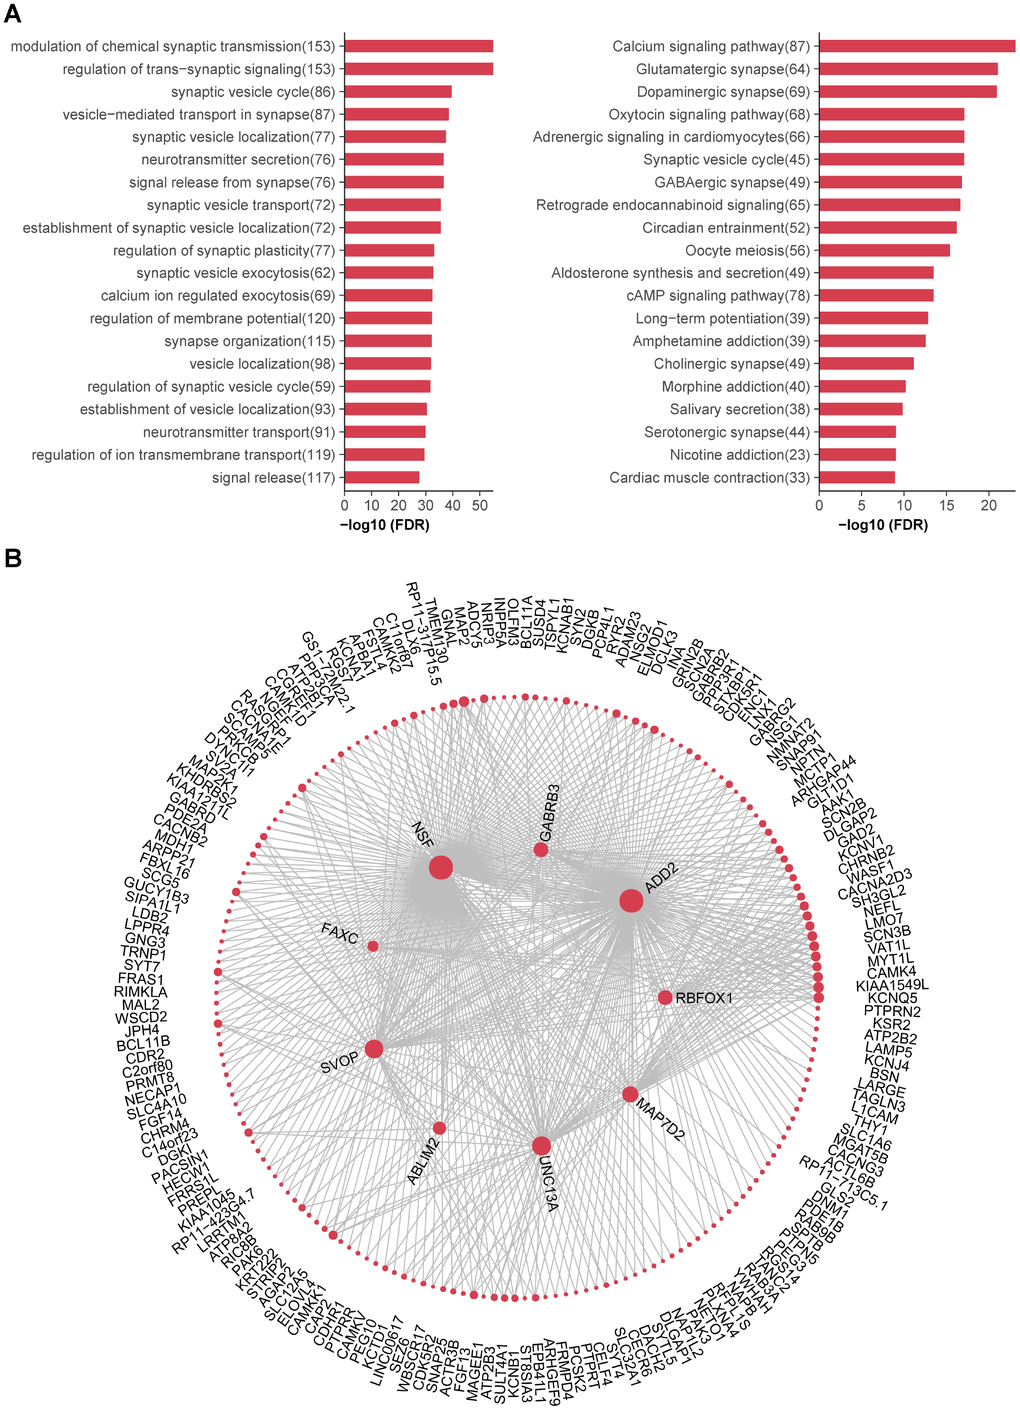
Figure 6.Functional annotations and hub genes of caudate modules. (A) (Left) Top 20 GO biological processes significantly enriched in turquoise module. (Right) Top 20 KEGG pathways significantly enriched in turquoise module. Numbers in the parenthesis indicate the numbers of genes associated with the respective terms. (B) Network plots showing top 500 connections in turquoise module; genes with most connections (hub genes) are shown in center. The size of each dot is proportional to log2 (number of connections for each gene).