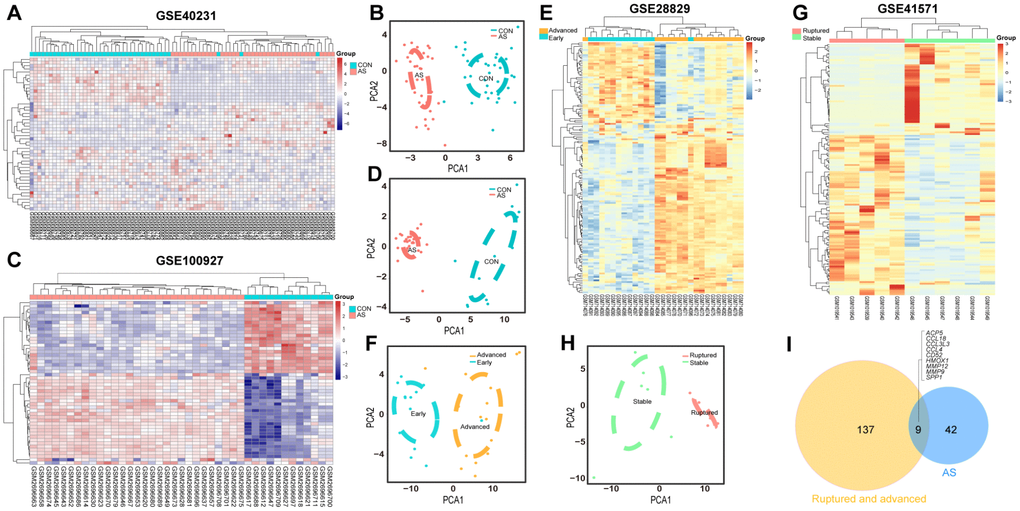
Figure 2.Heatmaps and PCA score trajectory plots showing relative fold changes (FCs) of mRNAs in differentiating plaque sets and heatmaps and PCA score trajectory plots in poor prognosis sets. (A, C, E, G) Heatmap showing 51 DEGs in the differentiating plaque sets and 146 DEGs in the poor prognosis sets after RRA analysis. In the differentiating plaque sets (GSE40231 and GSE100927), samples are sorted by columns, and genes are sorted by rows. Cyan squares represent the control group, and red squares represent the AS group. In the poor prognosis sets (GSE28829 and GSE41571), the blue/green square represents the early/stable stage of the AS group, and the yellow/red square represents the advanced/ruptured stage of the AS group. (B, D, F, H) PCA score trajectory plots showing obvious differences with those DEGs from RRA in the differentiating plaque sets or in the poor prognosis sets. (I) Venn diagram showing 51 DEGs in the differentiating plaque sets and 146 DEGs in the poor prognosis sets. A total of 9 shared hub genes were identified.