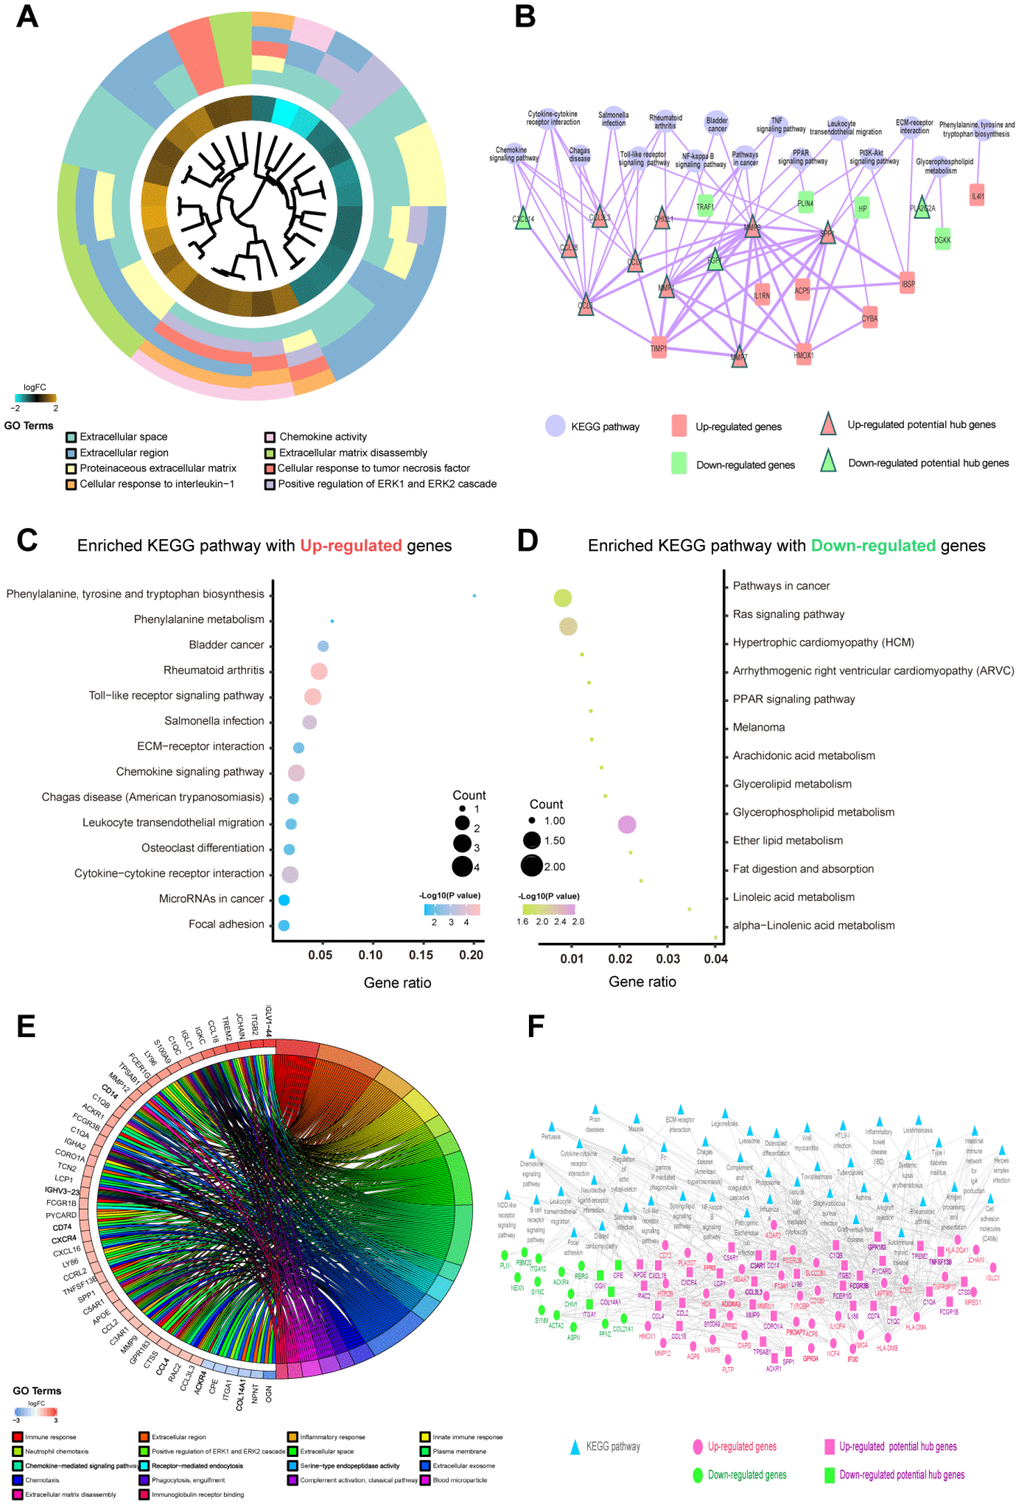
Figure 3.Functional enrichment analysis of candidate genes in differentiating plaque sets and poor prognosis sets. The potential hub genes were chosen using the p values corrected with the Holm step-down Bonferroni procedure. (A) GOCluster plot showing the relationship between 51 DEGs that were highly related to the AS state from RRA analysis and their related GO terms in differentiating plaque sets. For all genes, their high (low) logFC values are demonstrated by brown (turquoise) rectangles. (B) KEGG enrichment pathways and PPI network of the 51 DEGs were highly related to the AS state from the RRA analysis in differentiating plaque sets. The purple round node represents enriched pathways. Red rectangle nodes are upregulated genes, and red triangle nodes are upregulated potential hub genes. Green rectangle nodes are downregulated genes, and green triangle nodes are downregulated potential hub genes. The width of the line is proportional to the combined score of PPI. (C, D) An advanced bubble chart demonstrates enrichment of DEGs in signaling pathways in differentiating plaque sets. The Y-axis label is the pathway, and the X-axis label is the gene ratio (gene ratio=number of DEGs enriched in the pathway/amount number of all genes in background gene set). The size and color of the bubble represent the number of enriched DEGs of poor prognosis sets in the pathway and the significance of enrichment, respectively. (E) GOChord plot showing the 48 genes involved in more than 3 pathways and associated with ruptured and advanced plaques. Their contributions to the enrichment are arranged in the order of their level of expression. (F) KEGG enrichment pathways and PPI network of the 146 DEGs that were highly related to ruptured and advanced stages from the RRA analysis in poor prognosis sets. Blue triangular node: enriched pathways. Pink round node: upregulated genes, pink rectangular node: upregulated hub genes. Green round node: downregulated genes, green rectangular node: downregulated hub genes. The width of the line is proportional to the combined score of PPI.