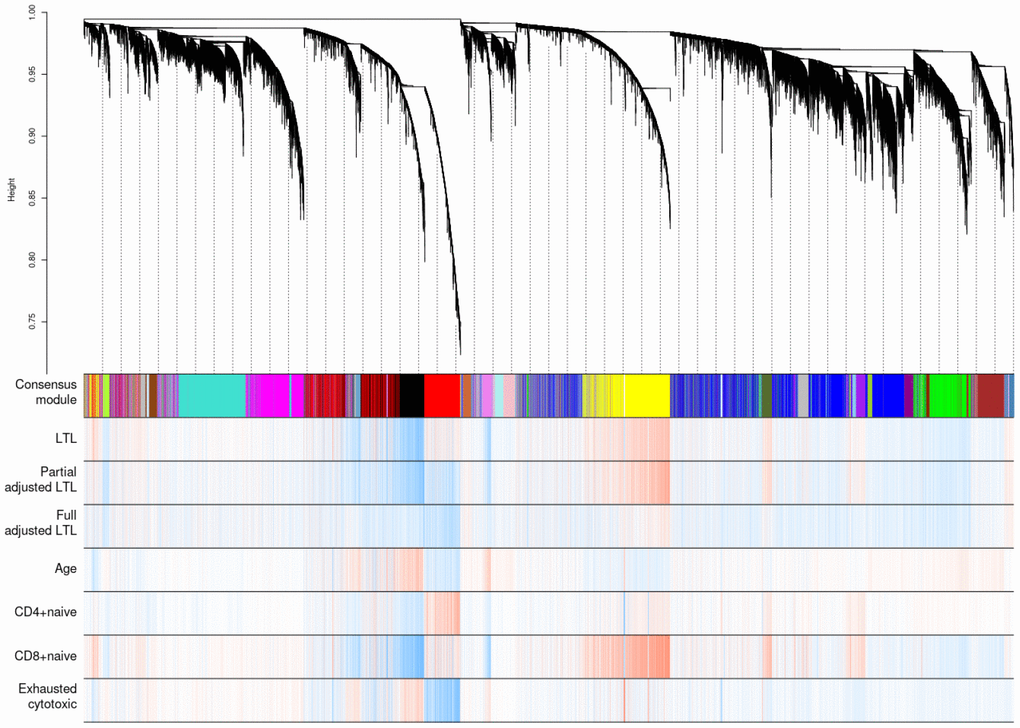
Figure 5.Hierarchical clustering of CpG sites by weighted gene co-expression network analysis (WGCNA). Each data point on the x-axis of the dendrogram refers to an individual CpG site. The color band ‘Consensus module’ displays co-methylated modules (clusters) in different colors. The other color bands highlight the degree of correlations between DNA methylation of CpG sites and traits of interest. Red represents a positive correlation, whereas blue represents a negative correlation.