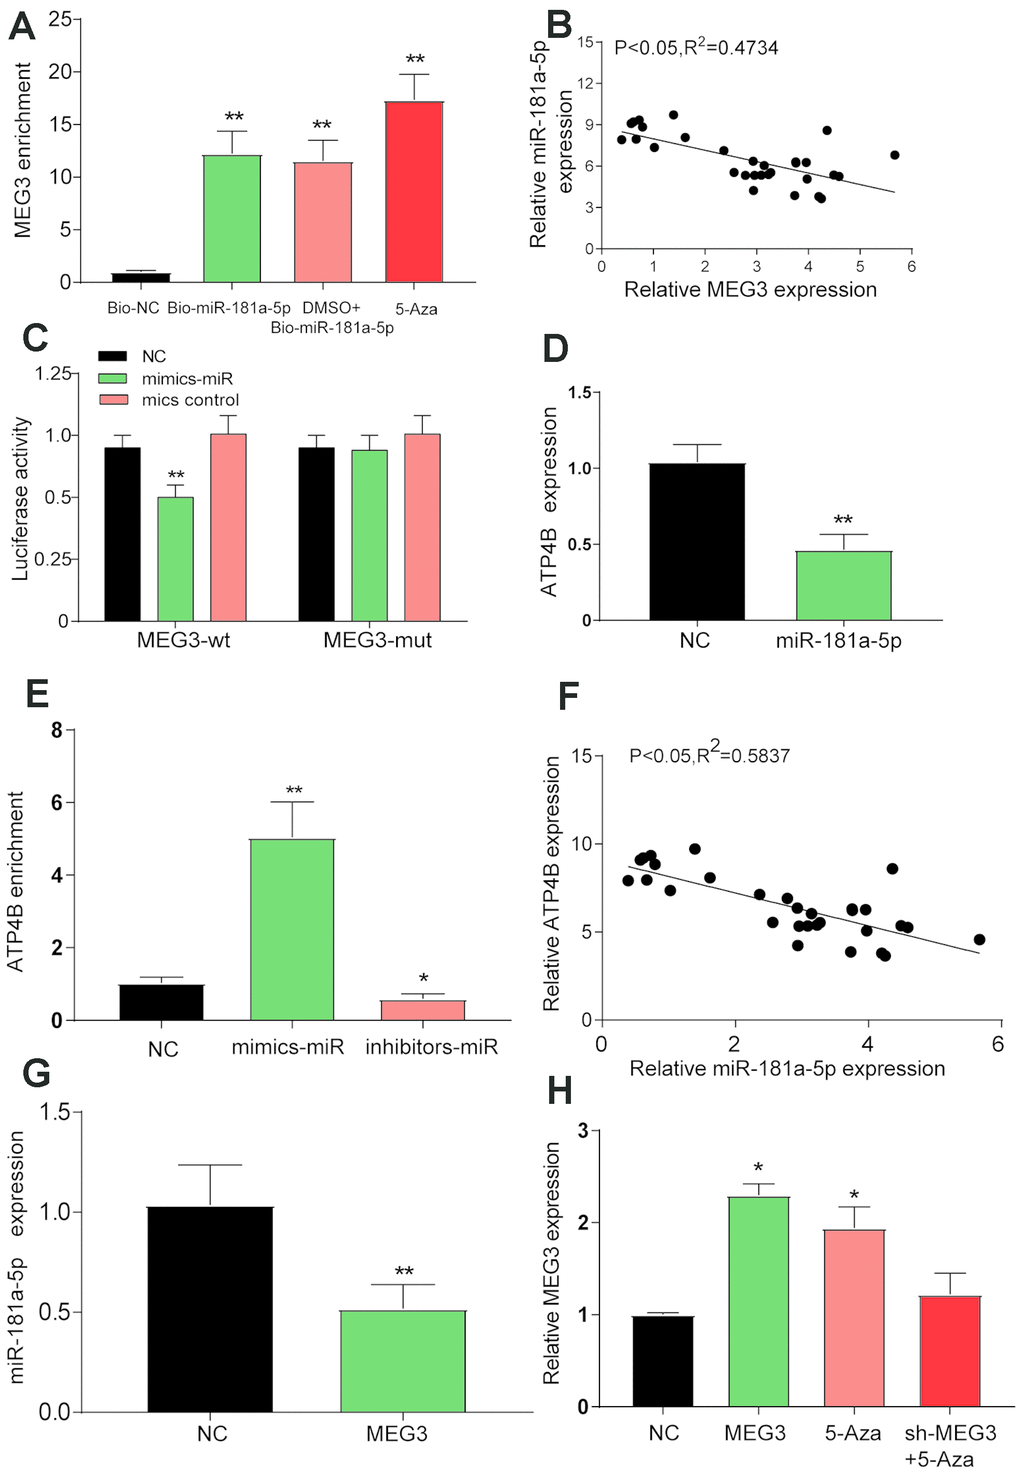
Figure 3.Verification of the target relationship between the three target genes. (A) The RNA pull-down test showed a low level of MEG3 enrichment in the bio-NC group than in the bio-miR-181a-5p, DMSO + 5-Aza and 5-Aza treatment groups. **P<0.01, compared with the bio-NC group. (B) A negative correlation between the expression of MEG3 and miR-181a-5p was detected by linear regression analysis after qRT-PCR detection of 30 tissue specimens. (C) Luciferase reporter assay showed lower luciferase activity in the mimic-miR + lncRNA MEG3-wt group than in the mimic-miR + lncRNA MEG3-mut group. *P<0.05, **P<0.01, compared with the NC group. (D) The expression of ATP4B was verified by qRT-PCR after the overexpression of miR-181a-5p. **P<0.01, compared with the NC group. (E) The RNA pull-down test showed a higher level of ATP4B enrichment in the inhibitor-miR group than in the mimic-miR group. *P<0.05, compared with the NC group. (F) qRT-PCR detection showed a negative relationship between the expression of ATP4B and miR-181a-5p. (G) The expression of miR-181a-5p was verified by qRT-PCR after the overexpression of MEG3. *P<0.05, compared with the NC group. (H) The expression level of each treatment group MEG3. *P<0.05, compared with the NC group.