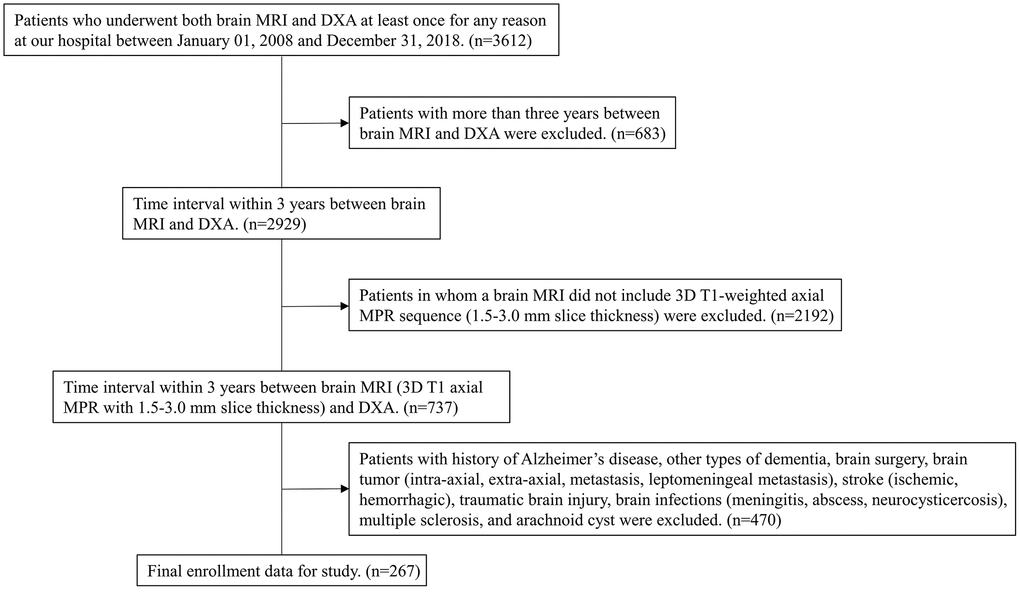
Figure 5.Flow chart of the process for selecting eligible patients from individuals who underwent both brain MRI and DXA in our hospital during the period of January 1, 2008, to December 31, 2018. MRI=magnetic resonance imaging; DXA=dual-energy X-ray absorptiometry; MPR=multiplanar reconstruction.