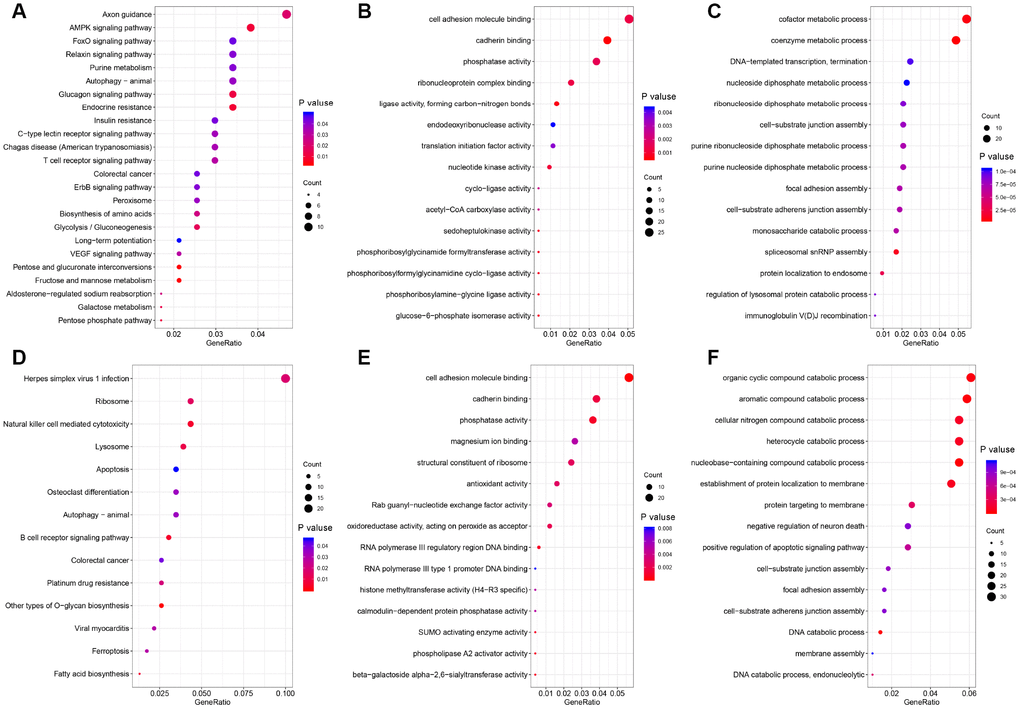
Figure 2.Functional GO analysis and KEGG analysis of DSGs between left- and right-sided colon cancer. The vertical axis represents GO or KEGG pathway annotations. The horizontal axis represents the number of genes assigned to the corresponding annotation. (A–C) right-sided colon cancer; (D–F) left-sided colon cancer. (A and D) KEGG pathways; (B and E) GO molecular functions; (C and F) GO biological processes.