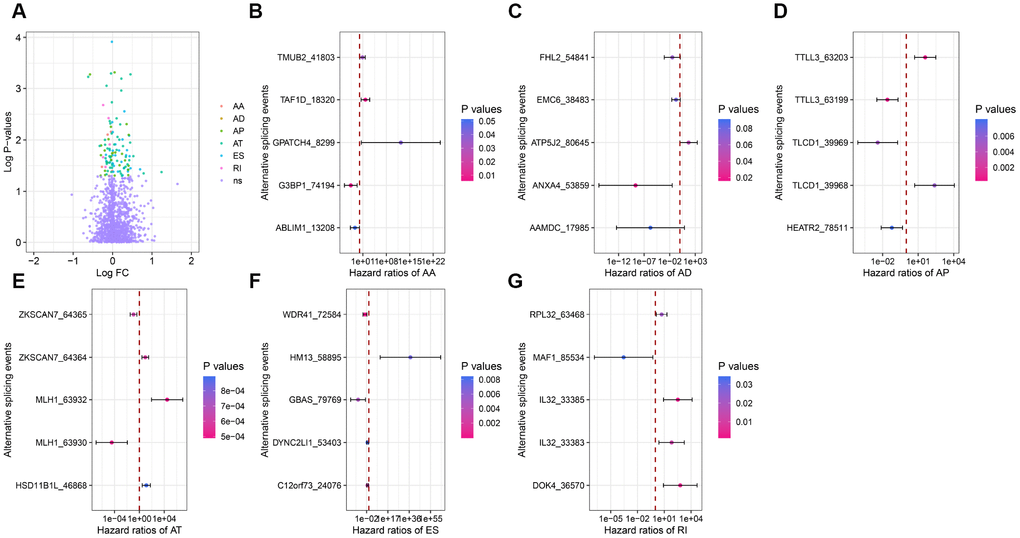
Figure 3.Forest plots for subgroup analyses of survival-associated DEAS. (A) Volcano plot depicting the P-values from univariate Cox regression analysis of the 1248 DEAS. Log FC: the log-transformed fold-change in the PSI value of a DEAS. (B–G) Forest plots of hazard ratios for the five AS events with the smallest P-values in the AA, AD, AP, AT, ES and RI splicing patterns, respectively. P-values are indicated by the color scale on the side. Horizontal bars represent the 95% confidence intervals.