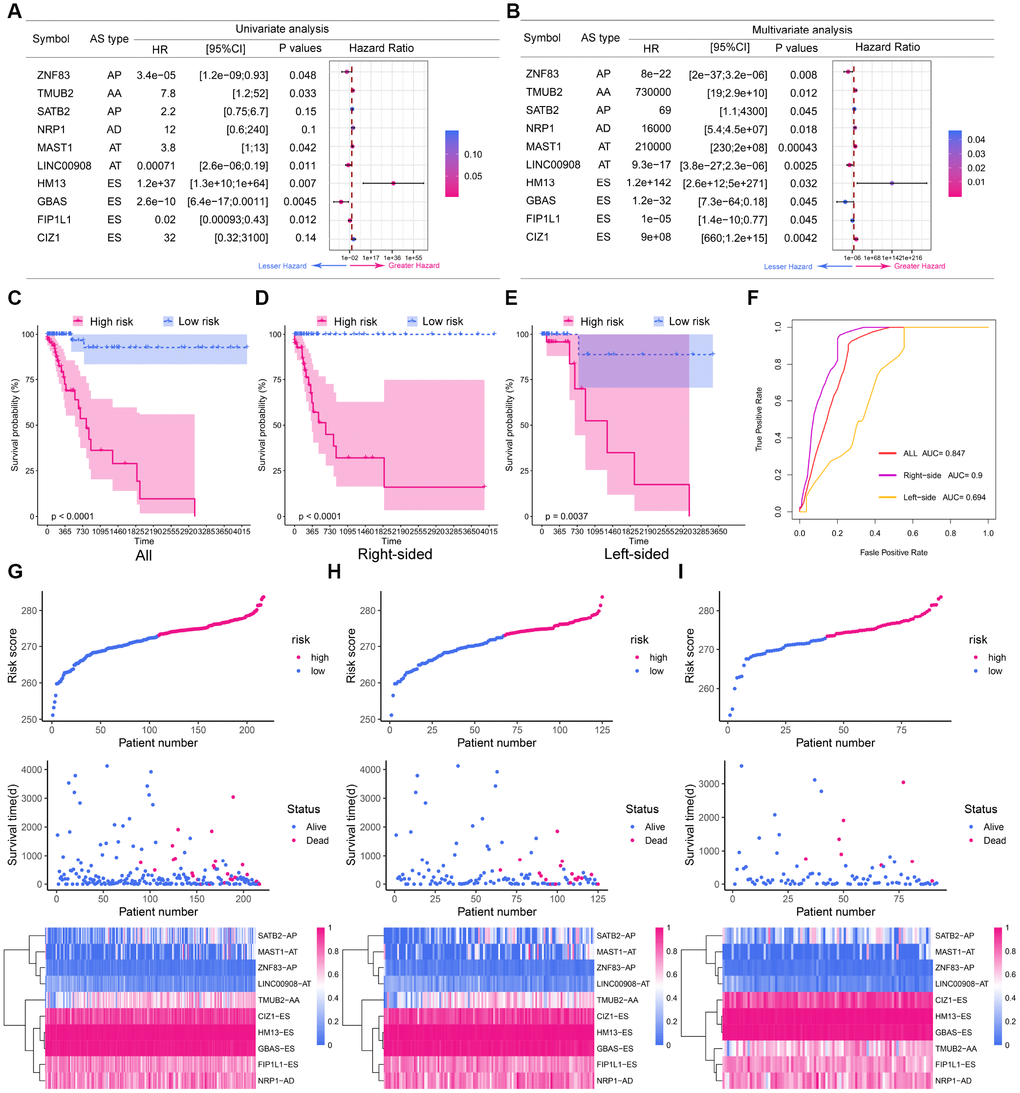
Figure 5.The prognostic value of the DEAS signature. (A) Univariate analysis of the 10 predictive factors for overall survival. P-values are indicated by the color scale on the side. Horizontal bars represent 95% confidence intervals. (B) Multivariate analysis of the 10 predictive factors for overall survival. P-values are indicated by the color scale on the side. Horizontal bars represent 95% confidence intervals. (C) Kaplan-Meier curves of the final prognostic model. Patients were divided into the high-risk and low-risk groups according to the median risk score. (D) Kaplan-Meier curves of the final prognostic model in right-sided colon cancer patients. (E) Kaplan-Meier curves of the final prognostic model in left-sided colon cancer patients. (F) The ROC curves of the final prognostic model in all, right-sided and left-sided colon cancer patients. (G–I) Construction and analysis of risk scores. The top panels indicate the risk scores of the patients. The middle panels depict the survival statuses and survival times of the patients distributed by risk score. The bottom panels display the heatmap of the PSI values for the 10 predictive factors distributed by risk score. (G) all patients; (H) right-sided colon cancer patients; (I) left-sided colon cancer patients.