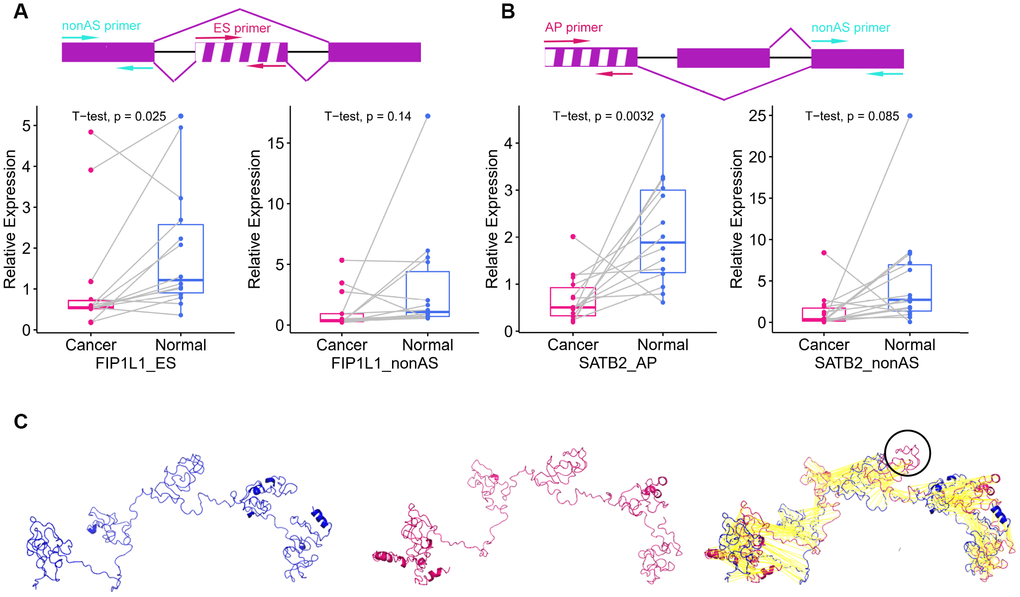
Figure 7.Survival-associated DEAS events expression in colon cancer and protein structure prediction. (A) The schematic diagram (top panel) depicts the ES of FIP1L1, where exon sequences are denoted by boxes and intron sequences are denoted by a horizontal line. The excluded exon is marked with a white stripe. The pair of red arrows indicates the primers amplifying the excluded exon, while the pair of cyan arrows indicates the primers amplifying the common exon among the different isoforms. The left panel displays the expression of FIP1L1-ES in cancer and adjacent tissues. The right panel displays the expression of FIP1L1 in cancer and adjacent tissues. (B) The schematic diagram (top panel) depicts the AP of SATB2, where exon sequences are denoted by boxes and intron sequences are denoted by a horizontal line. The excluded exon is marked with a white stripe. The pair of red arrows indicates the primers amplifying the excluded exon, while the pair of cyan arrows indicates the primers amplifying the common exon among the different isoforms. The left panel displays the expression of SATB2-AP in cancer and adjacent tissues. The right panel displays the expression of SATB2 in cancer and adjacent tissues. (C) Predicted structures of FIP1L1. The shorter variant (left panel) and longer variant (middle panel) were predicted by I-TASSER. The black circle in the right panel indicates the structure that could not be aligned.