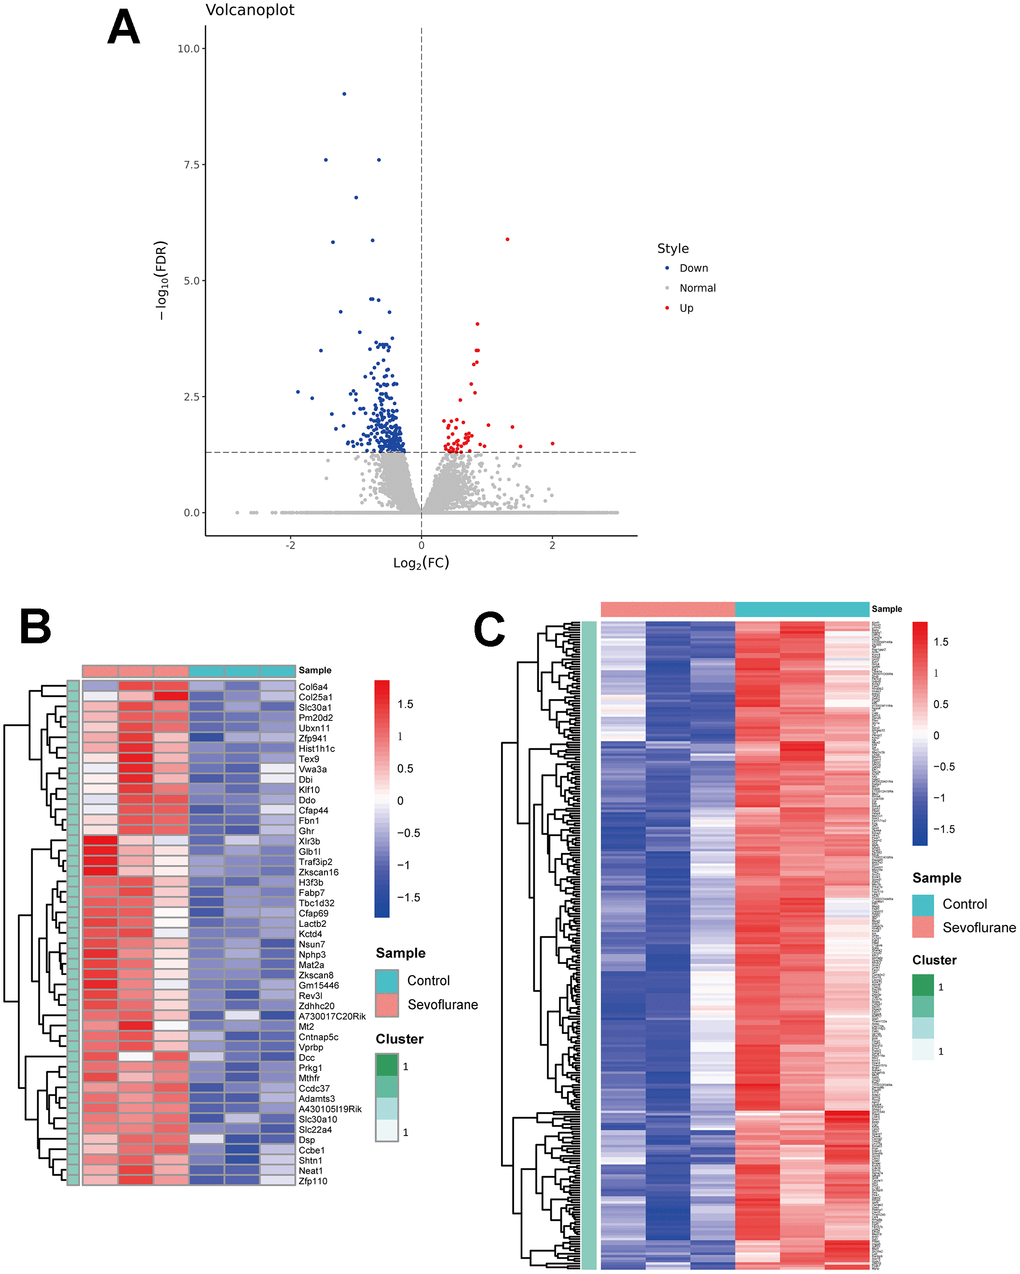
Figure 2.Volcano plot and heatmaps of DEGs in hippocampal tissues between sevoflurane-treated and control mice. (A) Volcano plot showing up-regulated (red dots) and down-regulated (blue dots) DEGs and normally expressed genes (gray dots). (B) Heatmap of 49 up-regulated DEGs. (C) Heatmap of 265 down-regulated DEGs.