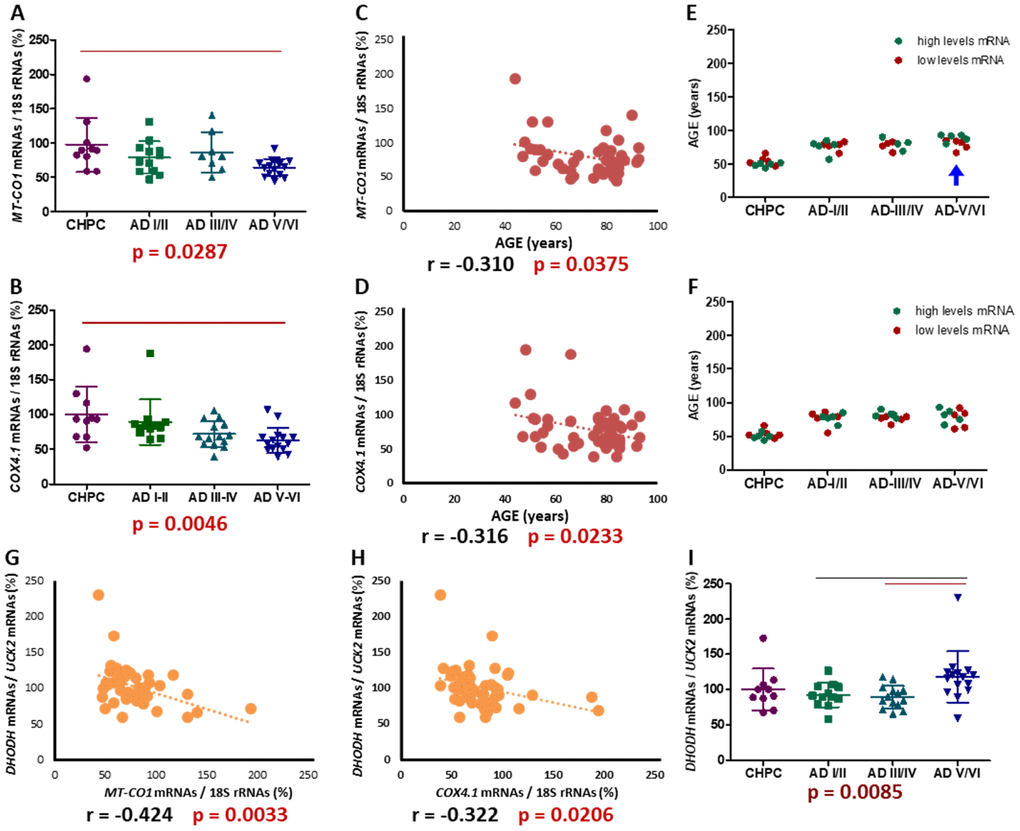
Figure 10.Entorhinal cortex MT-CO1 and COX4I1 mRNA levels. (A, B) MT-CO1 and COX4I1 mRNA levels, normalized by 18S rRNA, in different AD stages. Points represent individual samples and horizontal lines indicate mean ± standard deviation values. The p value for Kruskal-Wallis test is indicated under the graph. Red line indicates p < 0.0083 (fulfilling the post-hoc Bonferroni/Dunn criteria). (C, D) Correlations between age and MT-CO1 or COX4I1 mRNA levels. (E, F) Age distribution, according to MT-CO1 or COX4I1 mRNA levels, in different AD stages. Green and red dots indicate higher and lower half MT-CO1 or COX4I1 mRNA levels, respectively. Blue arrow indicates significant differences, in age, between individuals with higher and lower MT-CO1 mRNA levels. (G, H) Correlations between MT-CO1 or COX4I1 mRNA levels and DHODH/UCK2 ratio. (I) DHODH/UCK2 ratio in different AD stages. Points represent individual samples and horizontal lines indicate mean ± standard deviation values. The p value for Kruskal-Wallis test is indicated under the graph. Black and red lines indicate p ≤ 0.05 or, fulfilling the Bonferroni/Dunn criteria, p < 0.0083.