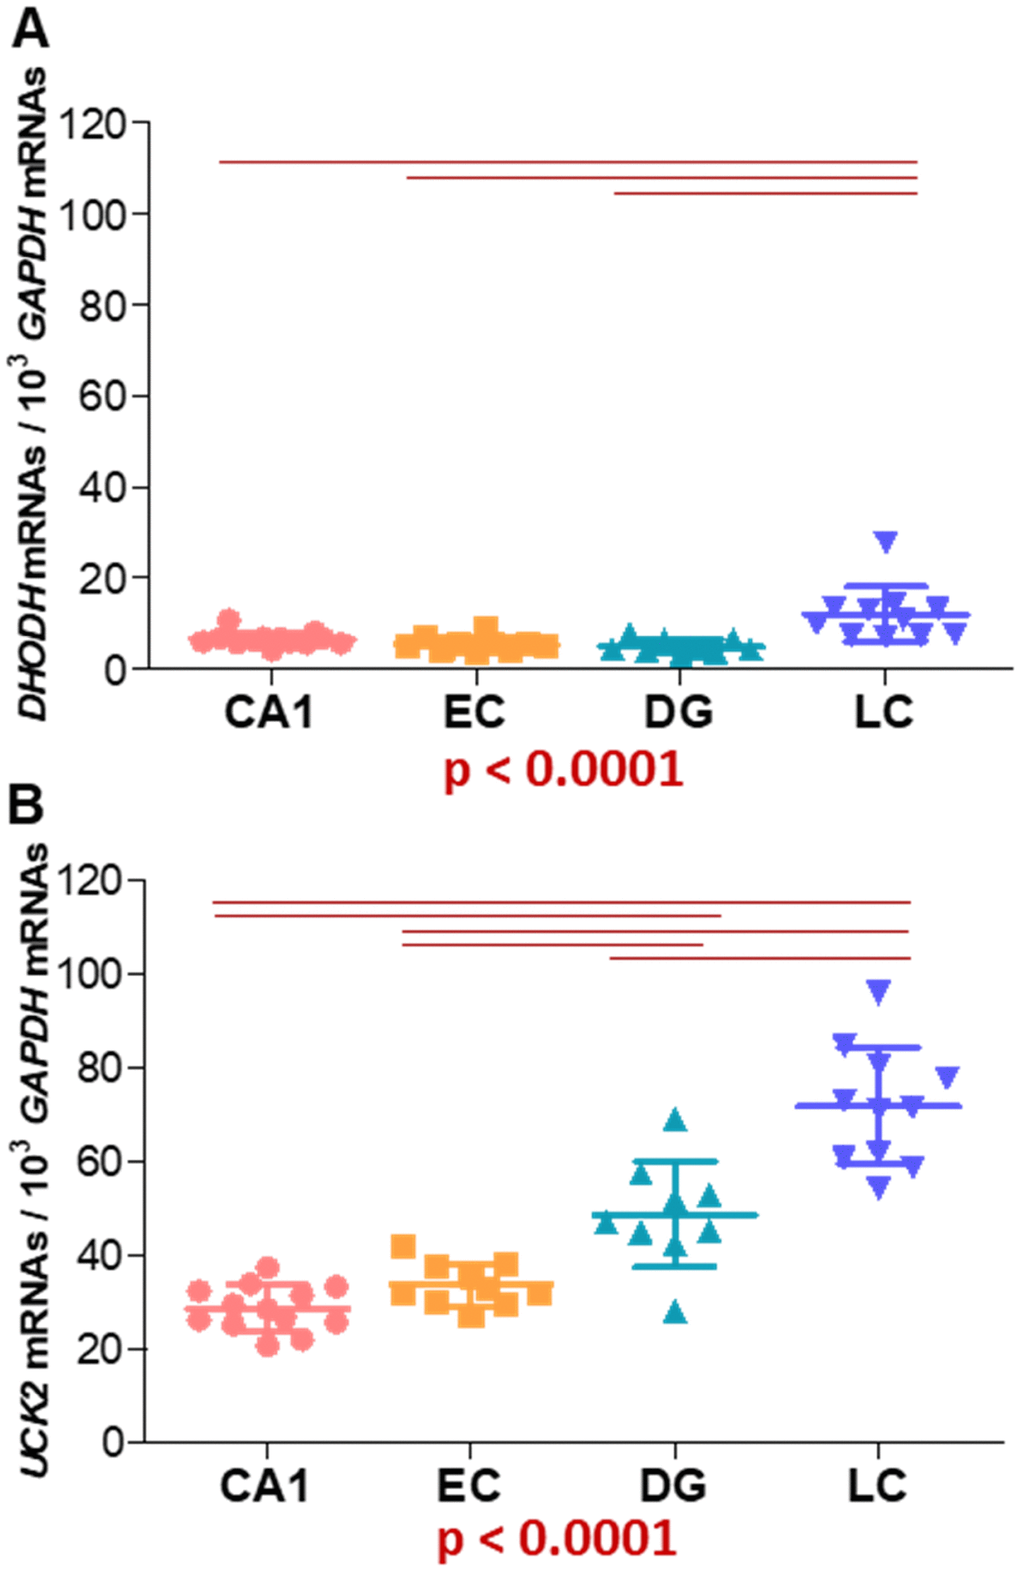
Figure 5.Expression of genes encoding (A) DHODH and (B) UCK2 proteins from both pyrimidine nucleotide synthesis pathways. GAPDH mRNA levels have been used to normalize. CA1: hippocampal cornus ammon 1; EC: entorhinal cortex; DG: dentate gyrus; LC: locus ceruleus. Points represent individual samples and horizontal lines indicate mean ± standard deviation values. P values for Kruskal-Wallis tests are indicated under the graphs. Horizontal red lines indicate between-regions p values (p < 0.0083) fulfilling the post-hoc Bonferroni/Dunn criteria.