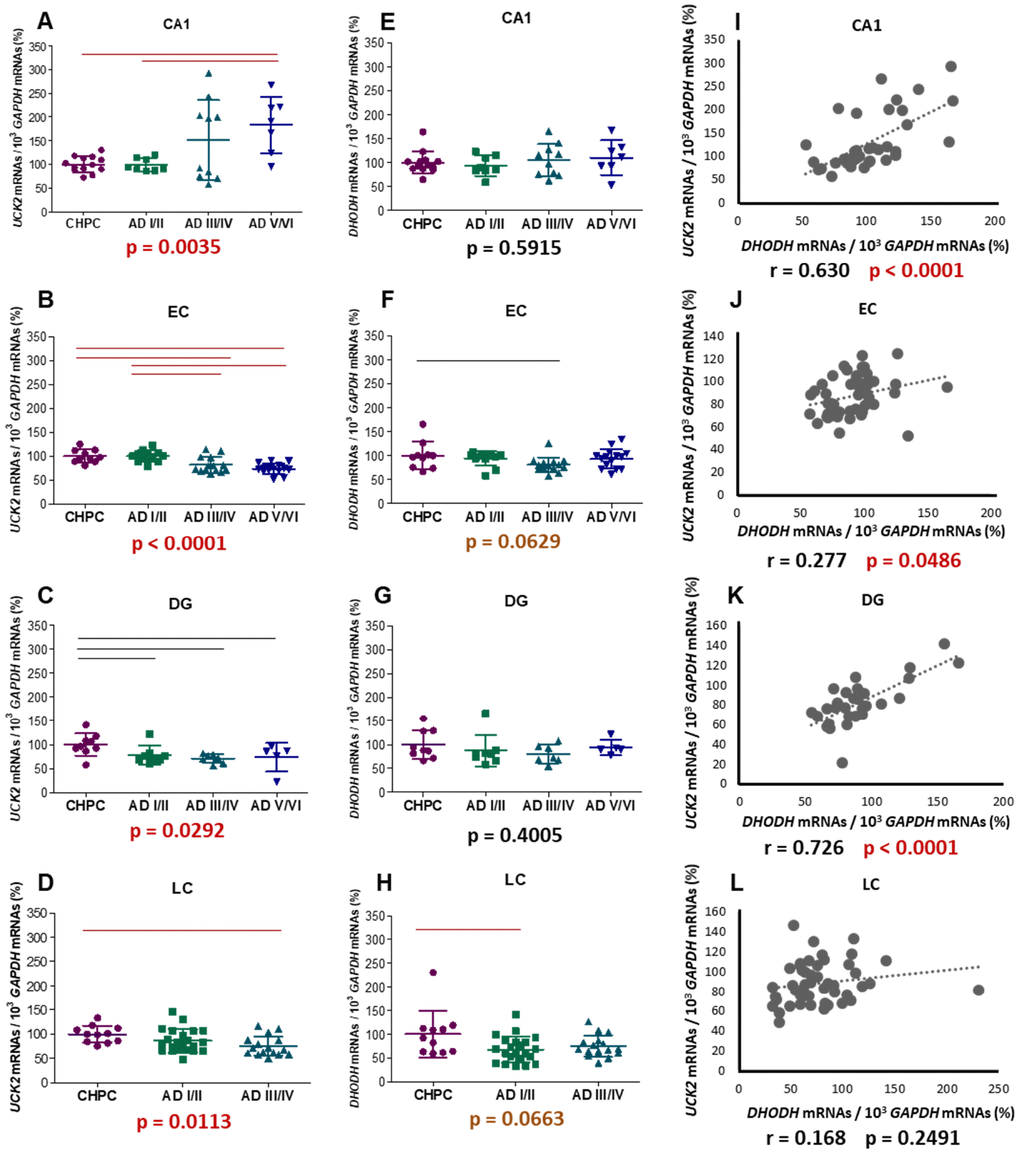
Figure 9.mRNA levels of selected genes encoding proteins from both pyrimidine nucleotide synthesis pathways. Graphs represent mean ± standard deviation values of UCK2 (A–D), DHODH (E–H), and DHODH - UCK2 correlations (I–L); respectively. GAPDH mRNA levels have been used to normalize. CA1: hippocampal cornus ammon 1; EC: entorhinal cortex; DG: dentate gyrus; LC: locus ceruleus. Each point represents an individual sample. The p values for Kruskal-Wallis or ANOVA tests are indicated under the graphs. Red and black horizontal lines indicate significant p values, fulfilling (p < 0.0083, p < 0.0167 in LC) or no (p ≤ 0.05) the post-hoc Bonferroni/Dunn criteria.