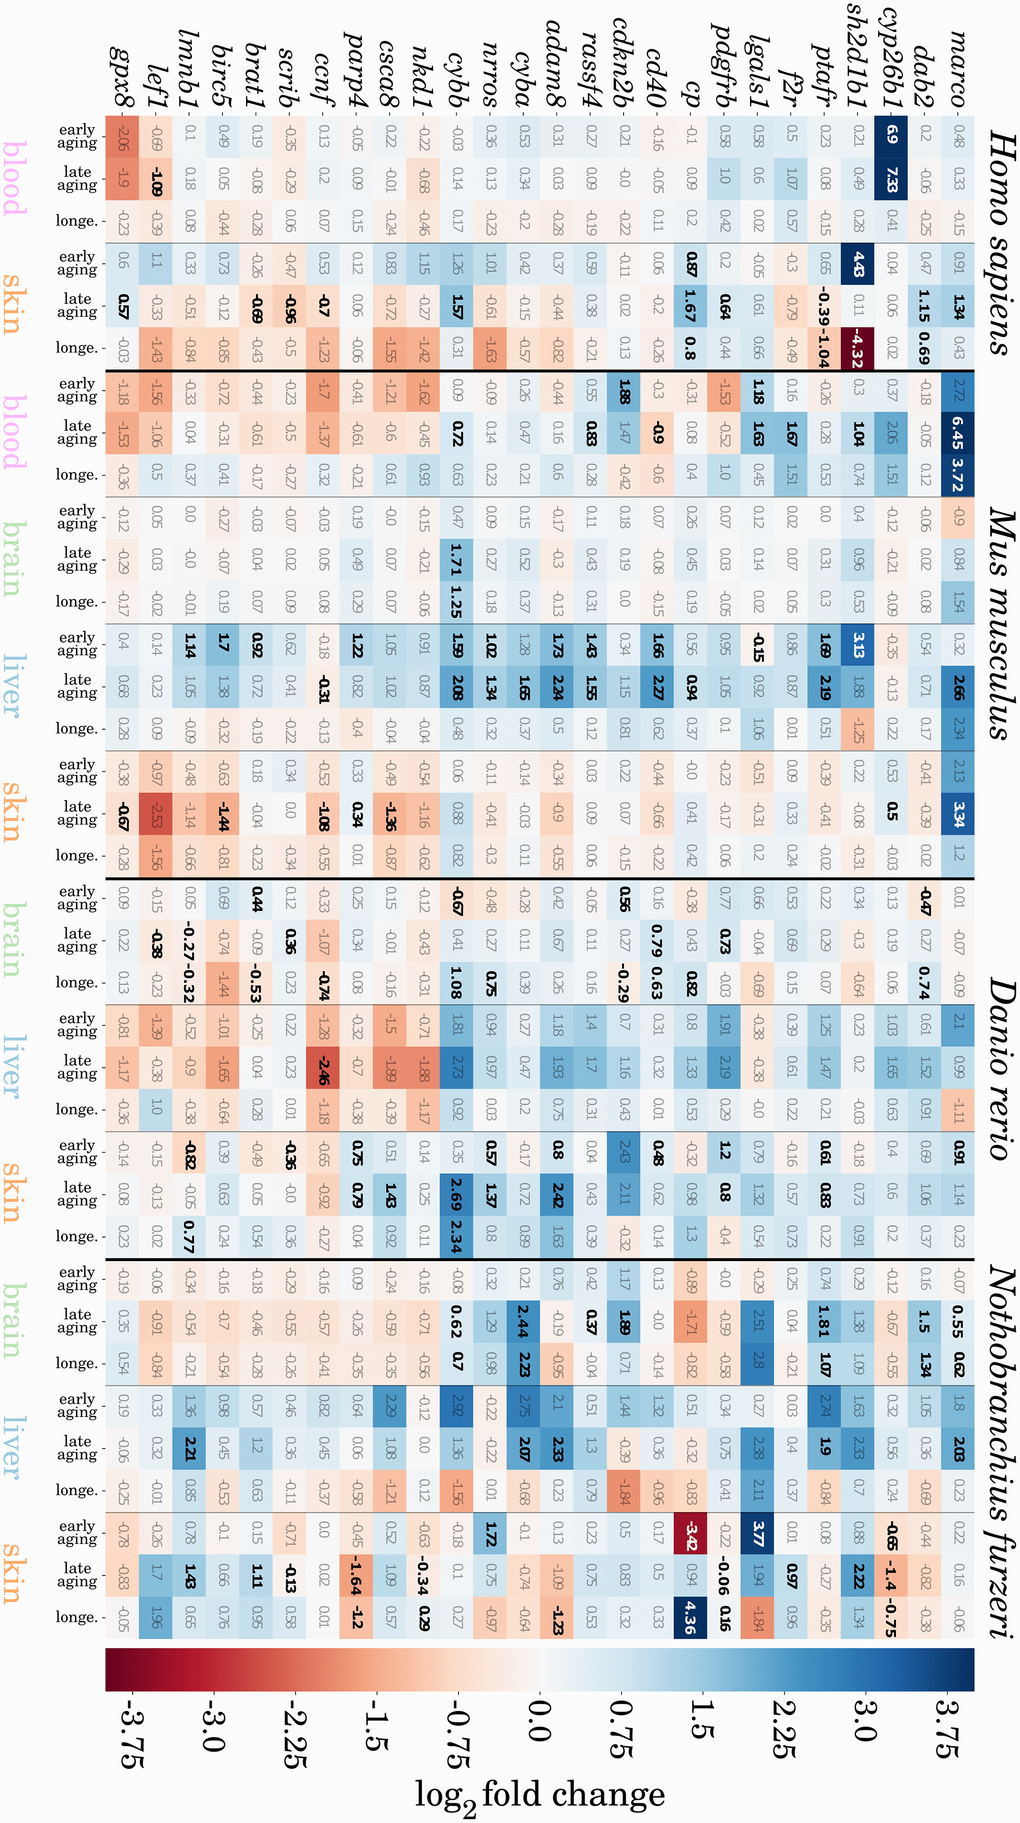
Figure 4.Heatmap representation of potentially conserved senescence- and inflammation-related genes. Genes are represented as mouse orthologues (a complete list of gene orthologues can be found in Supplementary Data 8). Numbers indicate log2 fold changes between two compared ages, where a positive value indicates an upregulation (blue), and a negative value downregulation (red) of the respective gene with aging. All significant changes in gene expression are indicated in bold. For detailed information, see Supplementary Data 7.