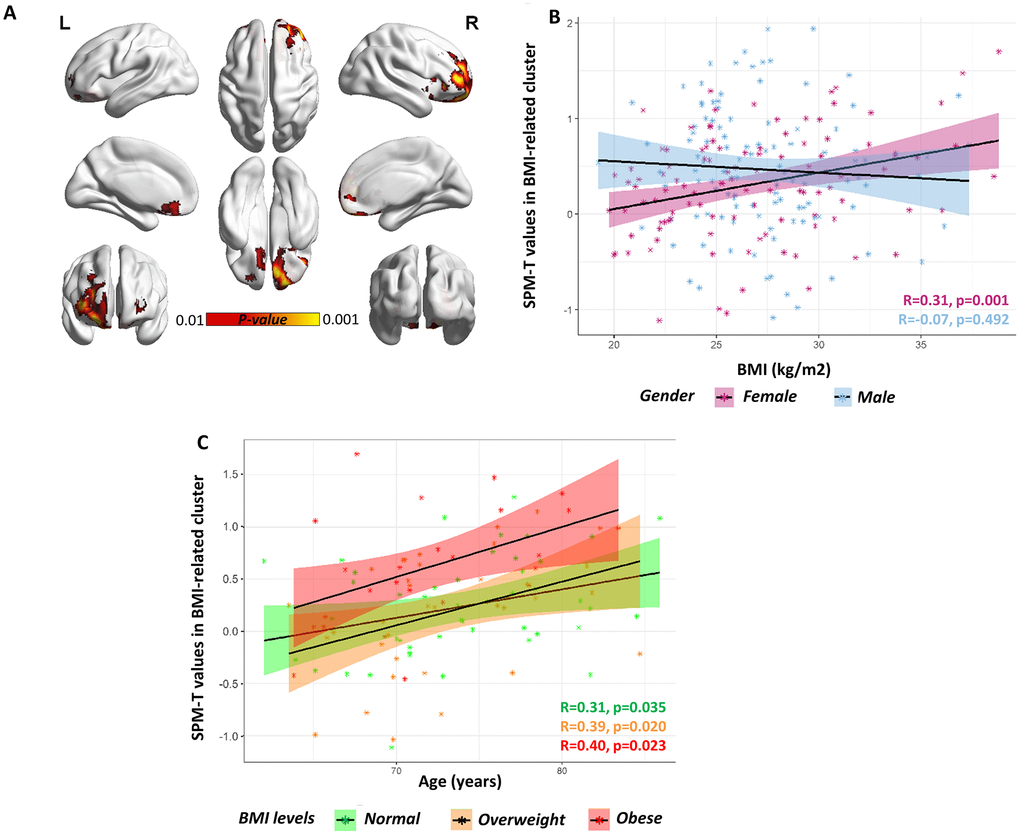
Figure 1.Gender-specific voxel-wise correlation between BMI levels and brain metabolism. (A) A significant positive correlation was found in orbitofrontal regions (partial R=0.44) in females. Statistical threshold was set at p<0.001 (uncorrected for multiple comparisons), with minimum cluster extent Ke:100 voxels (yellow). For visualization purposes, figure also shows voxels where correlation is significant at a more liberal threshold (p<0.01 uncorrected for multiple comparison; red). For both p<0.001 and p<0.01 voxel-level thresholds, only clusters surviving p<0.05 FWE-correction are shown. BrainNet Viewer (http://www.nitrc.org/projects/bnv/) was used for rendering [52]. (B) Scatter plot shows the significant BMI by gender interaction on orbitofrontal metabolism, with females showing a significant positive correlation between BMI levels (x axis) and average SPM-T values of glucose metabolism (y axis) (R=0.31, p<0.001; partial R=0.44, p<0.001) and males showing no correlation at all (R=-0.07, p=0.492; partial R=-0.01, p=0.881). Positive SPM-T values indicate higher-than-average mean orbitofrontal glucose metabolism: in females, higher BMI levels are associated with increased orbitofrontal glucose metabolism, crucially approaching critical hypermetabolism levels in the case with highest BMI levels (BMI ≈ 40kg/m2). Shaded areas represent confidence intervals for the regression line slope in each group. (C) Scatter plot shows the lack of a significant BMI by age interaction on orbitofrontal metabolism, despite of a significant principal effect of age (partial R=0.32, p<0.001), in the female cohort. The slope of the regression lines in the different (normal, overweight and obese) BMI groups does not differ: there is no significant interaction effect between age and BMI, but both age and BMI have an independent effect on orbitofrontal metabolism. Age (years) is plotted on the x axis and metabolism on the y axis. Shaded areas represent confidence intervals for the regression line slope in each group.
Figure 1 — High body mass index, brain metabolism and connectivity: an unfavorable effect in elderly females | Aging