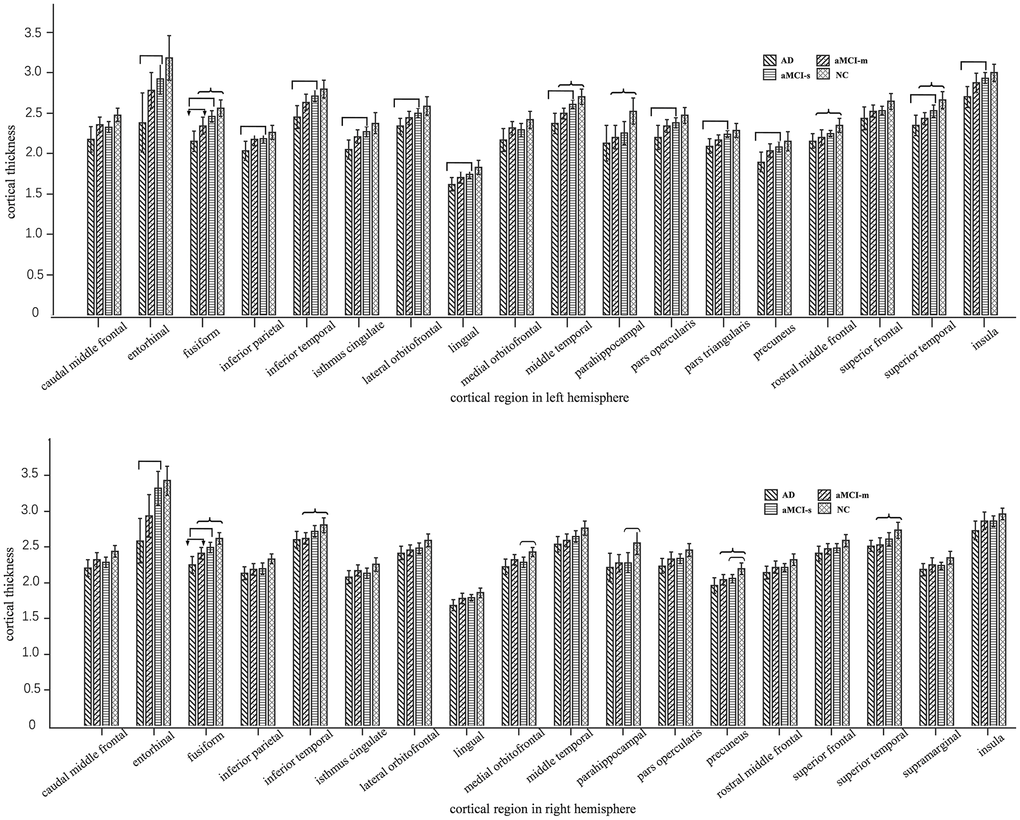
Figure 1.Plots of cortical thickness values with significant group differences in one-way ANOVA. The above one is left hemisphere and the below one is right hemisphere. We marked out the significantly different cortical thickness regions with Tukey’s multiple comparison test (p < 0.05) between AD and aMCI-m group (with marker), AD and aMCI-s group (with marker), aMCI-m and NC group (with marker), aMCI-s and NC group (with marker).