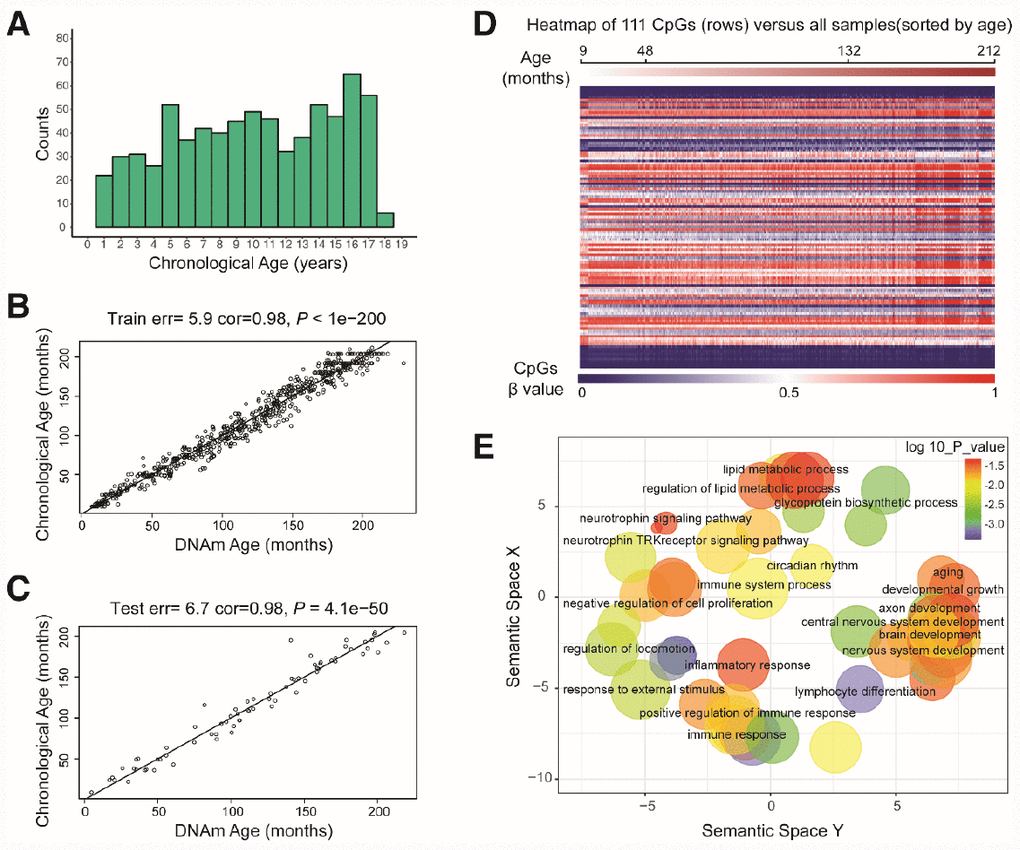
Figure 1.Characteristics of the prediction model. (A) Histogram of the age distribution for healthy children. The x-axis represents the chronological age of the individuals (age unit is years) and the y-axis (counts) represents the number of individuals. (B) Scatterplot of the DNA methylation (DNAm) age (x-axis) against the chronological age (y-axis) for the individuals in the training sets (age unit is months). For the training data, the correlation between the DNAm age and chronological age was 0.98, and the error (median absolute difference) was 5.9 months. (C) Scatterplot of the DNAm age (x-axis) against the chronological age (y-axis) for individuals in the test sets (age unit is months). For the test data, the correlation was 0.98 and the error was 6.7 months. (D) Heatmap of the DNA methylation levels of 111 CpG sites. Each row represents one CpG site, and the blue to red color spectrum represents β values from 0 to 1. The individuals are sorted by age (9 to 212 months), and it can be seen that the DNA methylation levels change with age. (E) Gene ontology analysis of the 111 CpG sites revealed several ontologies (P < 0.05) that may be associated with development and aging. Biological process gene ontologies were plotted in a sematic space with REVIGO, which groups related ontologies together.