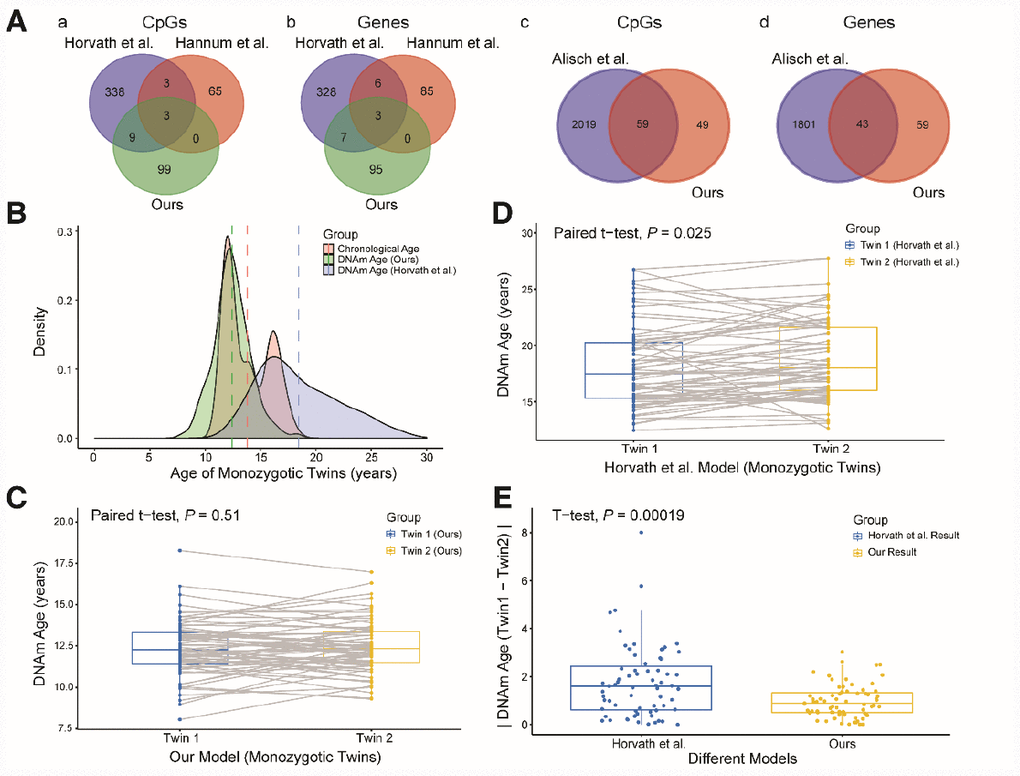
Figure 3.Comparison and verification of our model. (A) (a and b) Venn diagrams of the CpG sites (a) and genes associated with the CpG sites (b) selected from the three models. (c and d) Venn diagrams of the CpG sites (c) and genes (d) associated with age from our study and the study of Alisch et al. (B) Density plot of age and DNA methylation (DNAm) age. The red peak represents the chronological age, the green peak represents the DNAm age predicted by our model, and the blue peak represents the DNAm age predicted by Horvath et al. Dashed lines represent mean values. (C) Boxplot comparing the DNAm ages predicted by our model for monozygotic twins (paired t-test, n = 67 each for twins 1 and 2). The blue box indicates twin 1 and the yellow box indicates twin 2. (D) Boxplot comparing the DNAm ages predicted by the model of Horvath et al. for monozygotic twins (paired t-test, n = 67 each for twins 1 and 2). The blue box indicates twin 1 and the yellow box indicates twin 2. (E) Boxplot comparing the absolute values of the DNAm age differences of monozygotic twins predicted by the two models (two-sided t-test, n = 67). The blue box indicates the results from Horvath et al. and the yellow box indicates our results.