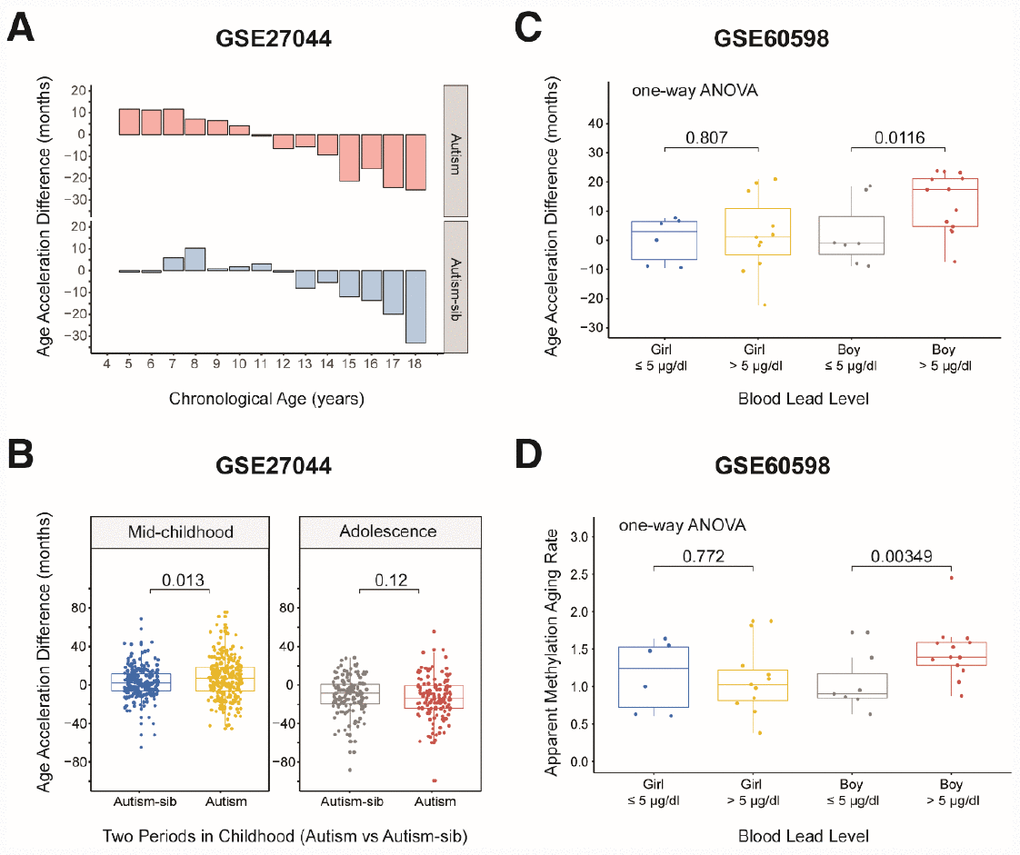
Figure 5.Age acceleration in children with diseases. (A) Histograms of the mean value distribution of the age acceleration difference in autistic children and their unaffected siblings. The pink columns indicate the children with autism, while the blue columns indicate their unaffected siblings (‘Autism-sib’). (B) Boxplot comparing the age acceleration difference between autistic children and their unaffected siblings during two periods of childhood. The blue box and the yellow box indicate the autistic children and their unaffected siblings, respectively, in mid-childhood. The gray box and the red box indicate the autistic children and their unaffected siblings, respectively, in adolescence. (C) Boxplot comparing the age acceleration differences of boys and girls with different blood lead levels. A cutoff value of 5 μg/dL was used for the blood lead level. The jitter points represent the age acceleration differences of individual samples. (D) Boxplot comparing the apparent methylation aging rates of boys and girls with different blood lead levels. A cutoff value of 5 μg/dL was used for the blood lead level. The jitter points represent the apparent methylation aging rates of individual samples.