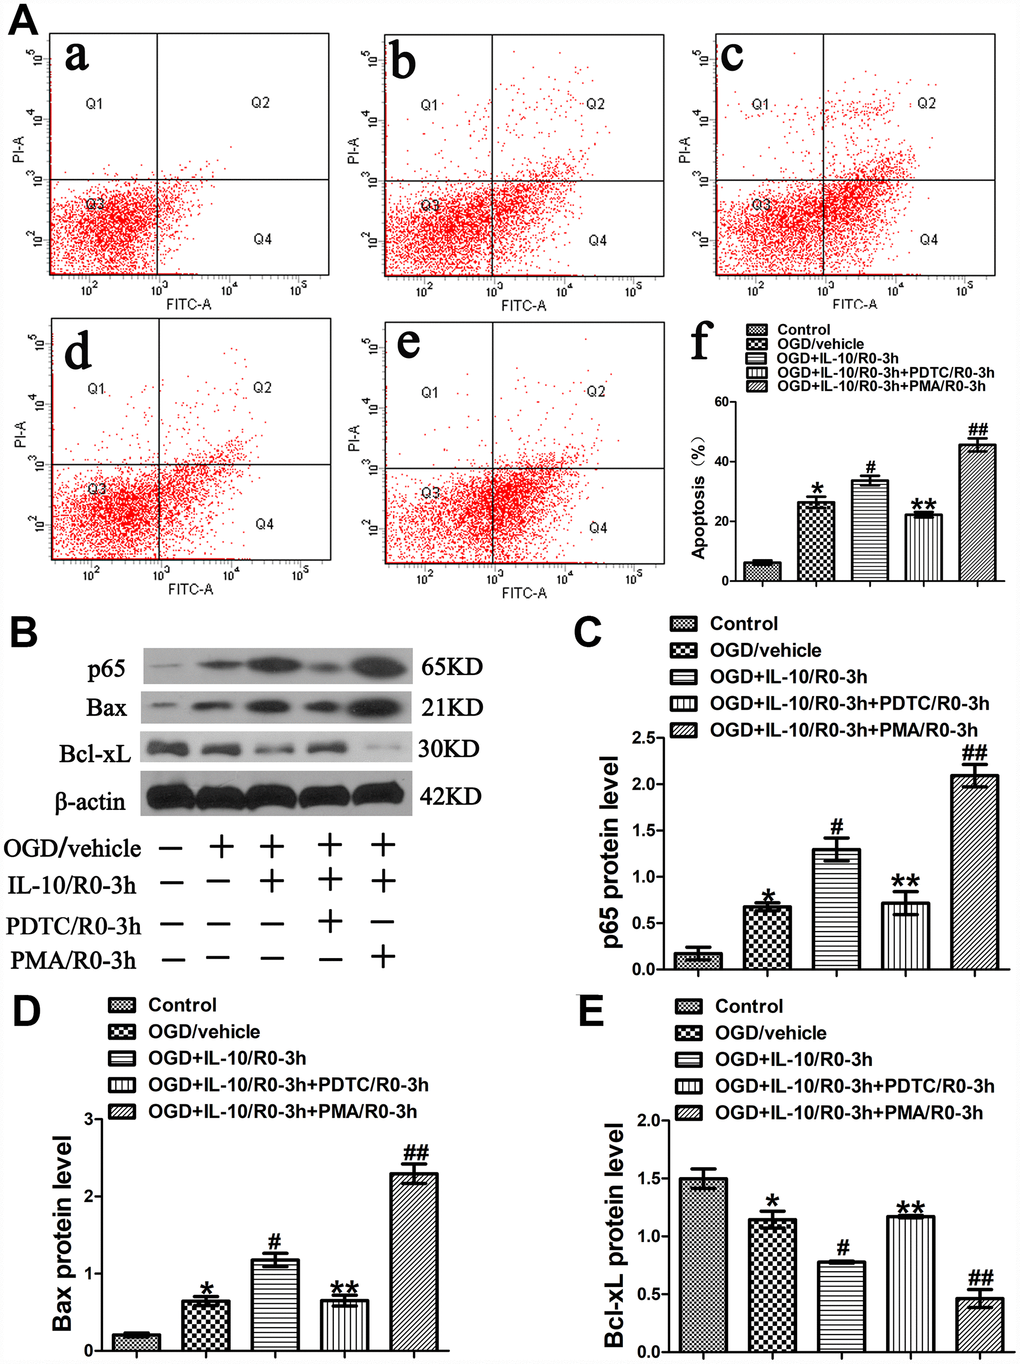
Figure 3.OGD-induced apoptosis increased by IL-10 via p65 at an early stage after OGD injury. (A) Forty-eight hours after OGD, apoptosis of neurons was detected by flow cytometry. The signals from apoptotic neurons were localized in the Q2 and Q4 quadrants of the resulting dot-plot graph. (a) Control group; (b) OGD group; (c) OGD+IL-10/R0-3h group; (d) OGD+IL-10/R0-3h+PDTC/R0-3h; (e) OGD+IL-10/R0-3h+PMA/R0-3h group; (f) Statistical graph of apoptosis in different groups (n=3). *p<0.001, as compared with Control group; #p<0.01, as compared with OGD group; **p<0.01, as compared with OGD+IL-10/R0-3h group; ##p<0.001, as compared with OGD+IL-10/R0-3h group; by one way analysis of variance (ANOVA) followed by Student-Newman-Keuls multiple comparison test, F=85.931, p<0.0001. (B) The representative image of western blot analysis for p65, Bax and Bcl-xL expression. (C) Western blot analysis of p65 (n=3). *p<0.01, as compared with Control group; #p<0.01, as compared with OGD group; **p<0.01, as compared with OGD+IL-10/R0-3h group; ##p<0.001, as compared with OGD+IL-10/R0-3h group; by one way analysis of variance (ANOVA) followed by Student-Newman-Keuls multiple comparison test, F=52.058, p<0.0001. (D) Western blot analysis of Bax (n=3). *p<0.01, as compared with Control group; #p<0.01, as compared with OGD group; **p<0.01, as compared with OGD+IL-10/R0-3h group; ##p<0.001, as compared with OGD+IL-10/R0-3h group; by one way analysis of variance (ANOVA) followed by Student-Newman-Keuls multiple comparison test, F=100.199, p<0.0001. (E) Western blot analysis of Bcl-xL (n=3). *p<0.01, as compared with Control group; #p<0.01, as compared with OGD group; **p<0.01, as compared with OGD+IL-10/R0-3h group; ##p<0.01, as compared with OGD+IL-10/R0-3h group; by one way analysis of variance (ANOVA) followed by Student-Newman-Keuls multiple comparison test, F=43.085, p<0.0001. All data are presented as mean±SEM.