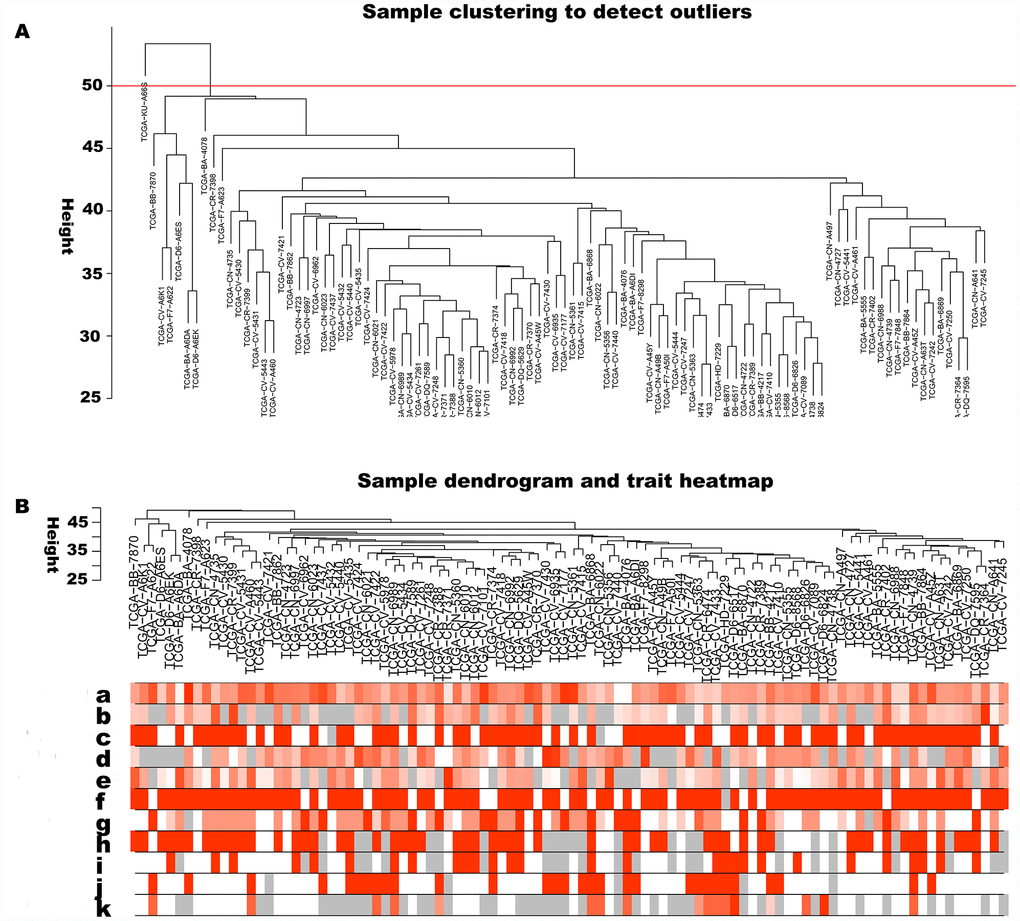
Figure 1.Sample cluster analysis based on RNA data from TCGA database. (A) Sample clustering to detect outliers based on RNA data. The red line represents the cut-off of data filtering in the step of data preprocessing. (B) Sample dendrogram and trait heatmap based on gene expression data and clinical data. (a) age at initial pathologic diagnosis, (b) history of smoking, (c) history of alcohol consumption, (d) intermediate dimension, (e) lymph node count, (f) neck lymph node dissection, (g) pathologic N stage, (h) radiation therapy, (i) targeted molecular therapy, (j) tumor status, (k) success of follow-up treatment.