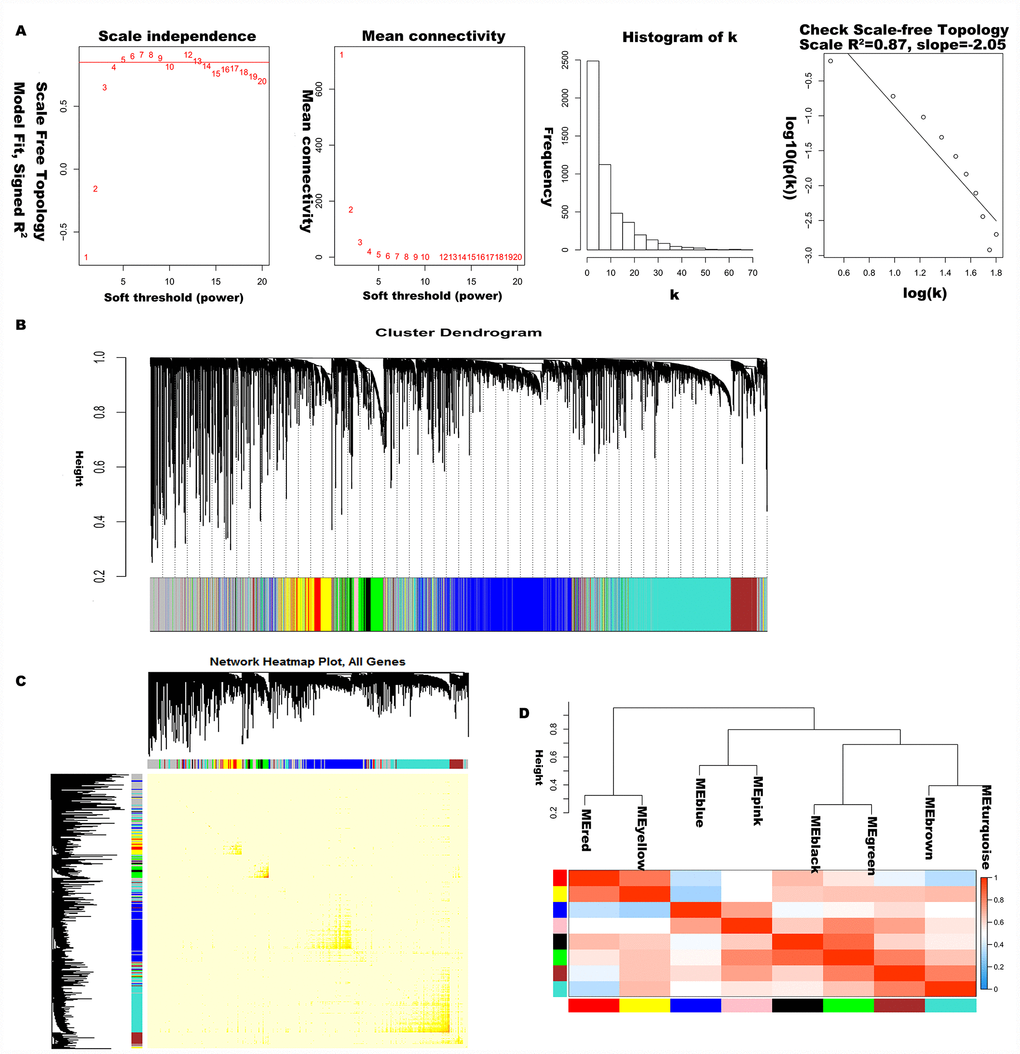
Figure 2.Construction of co-expression modules of LC. (A) Analysis of network topology for various soft-threshold powers. Check scale-free topology, and here the adjacency matrix was defined using soft-thresholds with beta= 5. (B) Clustering dendrograms of genes, with dissimilarity based on topological overlap, together with assigned module colors. (C) The heatmap depicts the topological overlap matrix (TOM) among genes based on co-expression modules. (D) Visualizing the gene network using a heatmap plot.