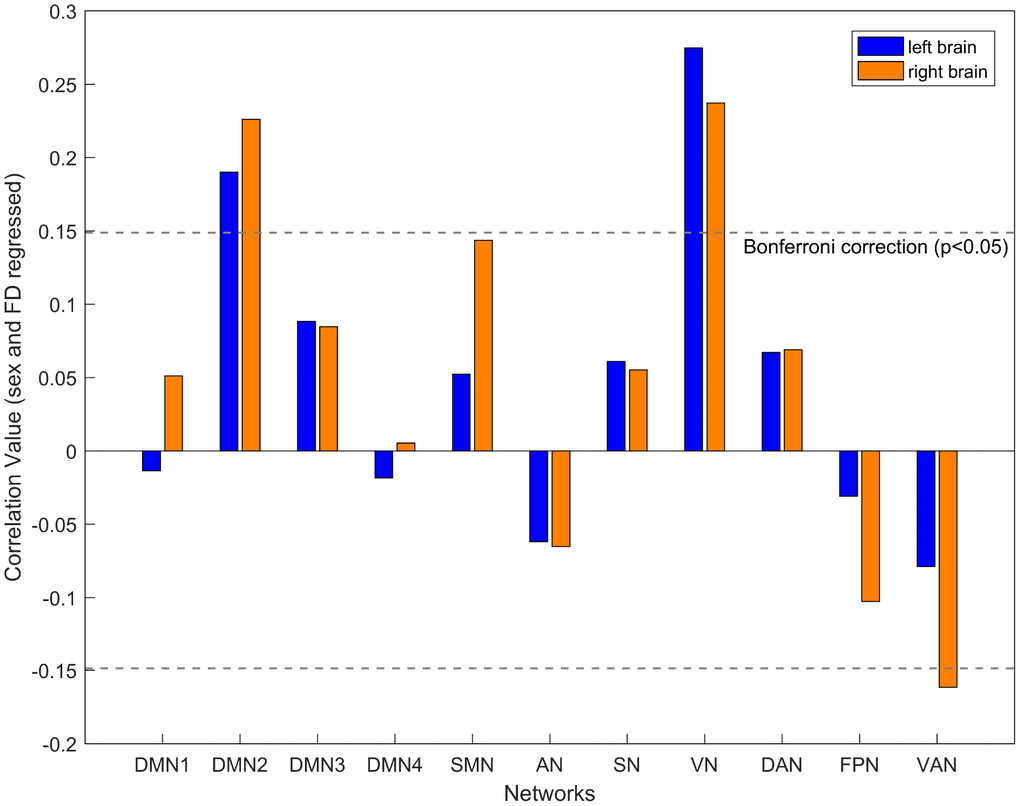
Figure 4.The relationship between age and intra-hemispheric integration for each network after controlling for the participant’s sex and mean FD. The blue box indicates the left hemisphere network, and the yellow box indicates the right hemisphere network. A significant correlation with the threshold of FDR-corrected p < 0.05.