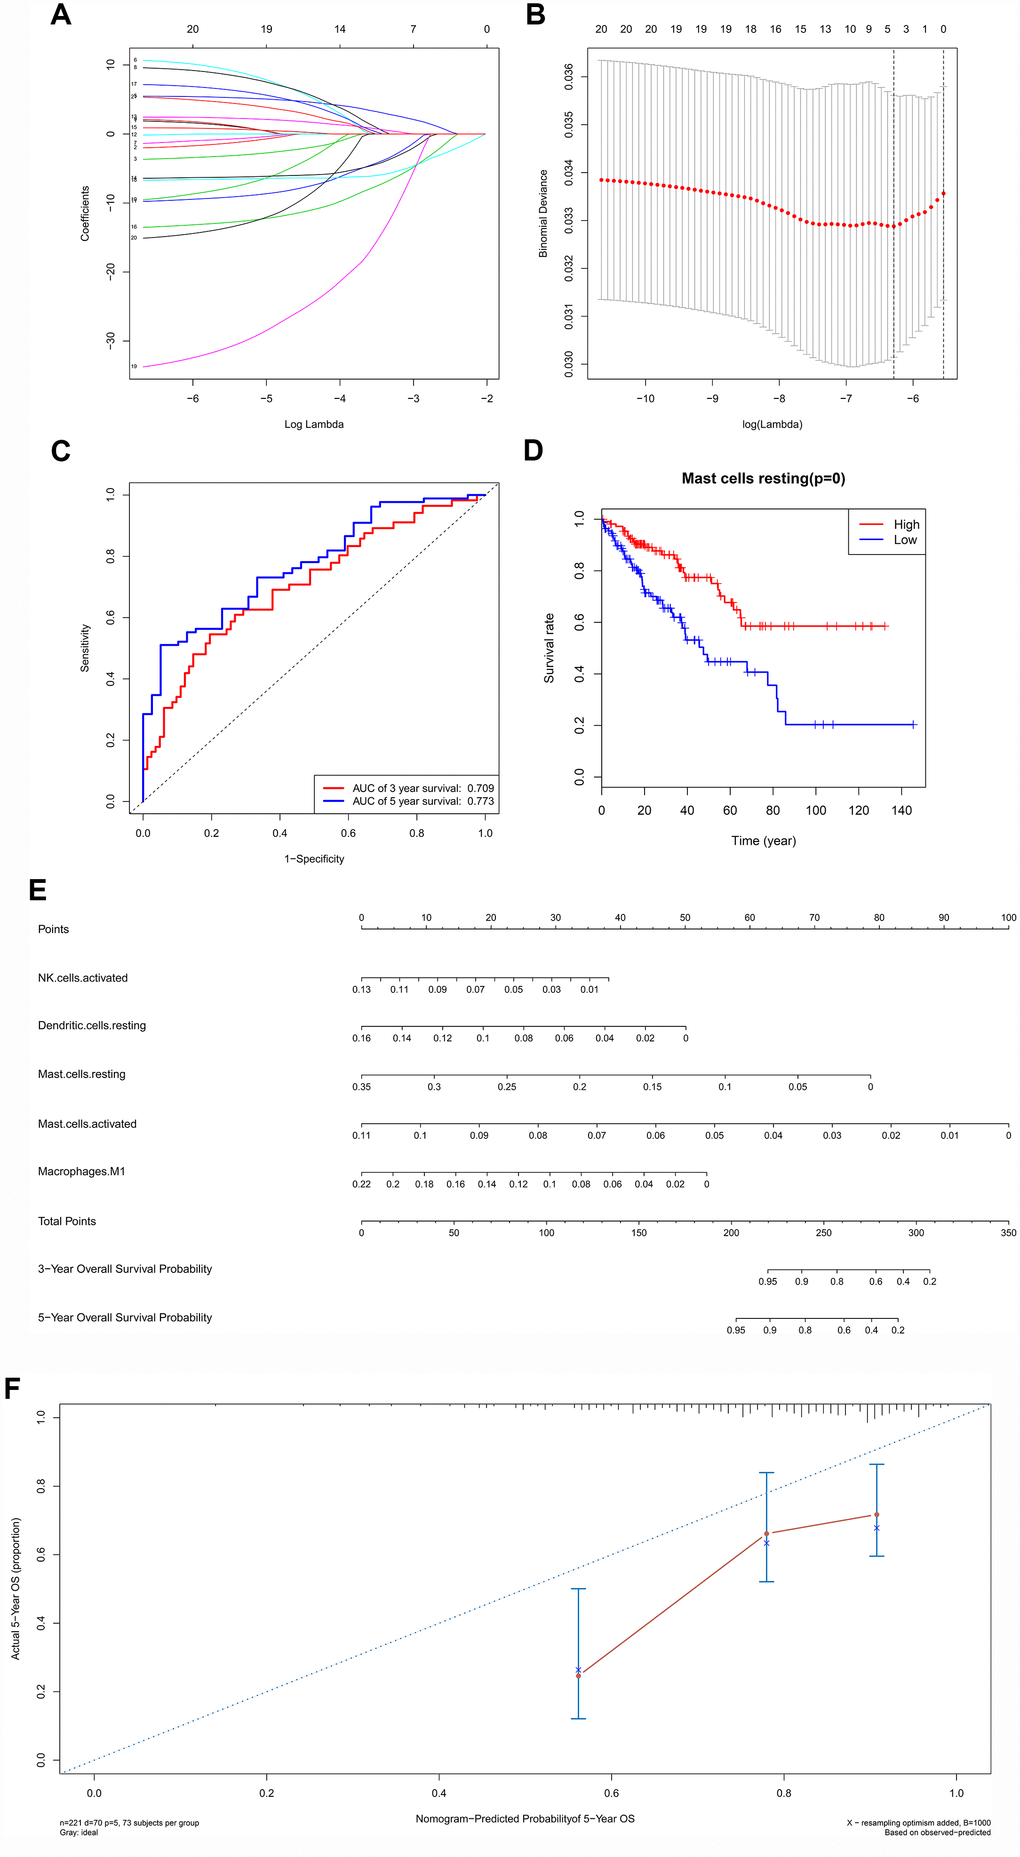
Figure 6.The results of the multivariate Cox regression, Lasso regression (A, B), Kaplan–Meier survival curve of (D), nomogram (E) and model diagnosis process (C, F) based on prognosis related immune cells. All immune cells were integrated into an initial Cox regression model. After the screening process of the Lasso regression, the results suggested that the model was not overfitting (A, B). The nomogram based on the multivariable model (E). The calibration curve and the ROC demonstrated good discrimination and concordance of the nomogram (AUC of 3-year survival: 0.709; AUC of 5-year survival: 0.773) (C, F).