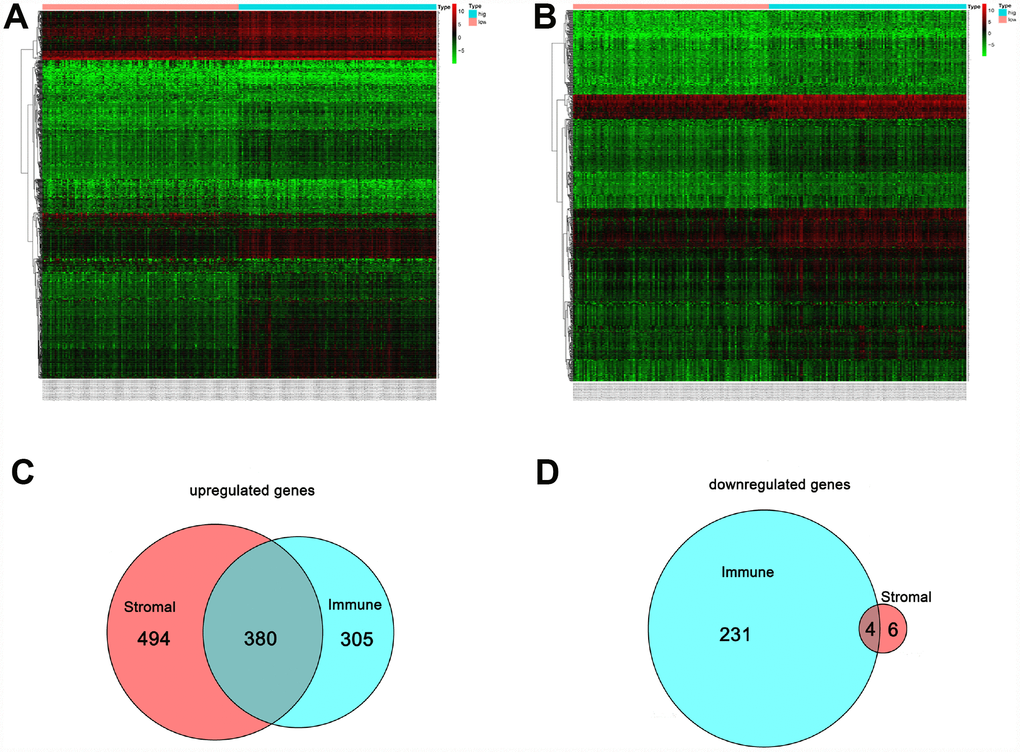
Figure 4.Comparison of the gene expression profile with immune and stromal scores. In the heat maps, genes with higher expression are shown in red, and lower expression are shown in green; genes expressed at the same level are in black. (A) Based on immune score comparisons, 685 genes were upregulated and 235 genes were downregulated in the high score group as compared to the low score group. (B) Based on stromal score comparisons, 874 genes were upregulated and 10 genes were downregulated in the high score group as compared to the low score group. (C) A total of 380 genes were commonly upregulated in the immune and stromal score groups. (D) A total of 4 genes were commonly downregulated in the immune and stromal score groups.