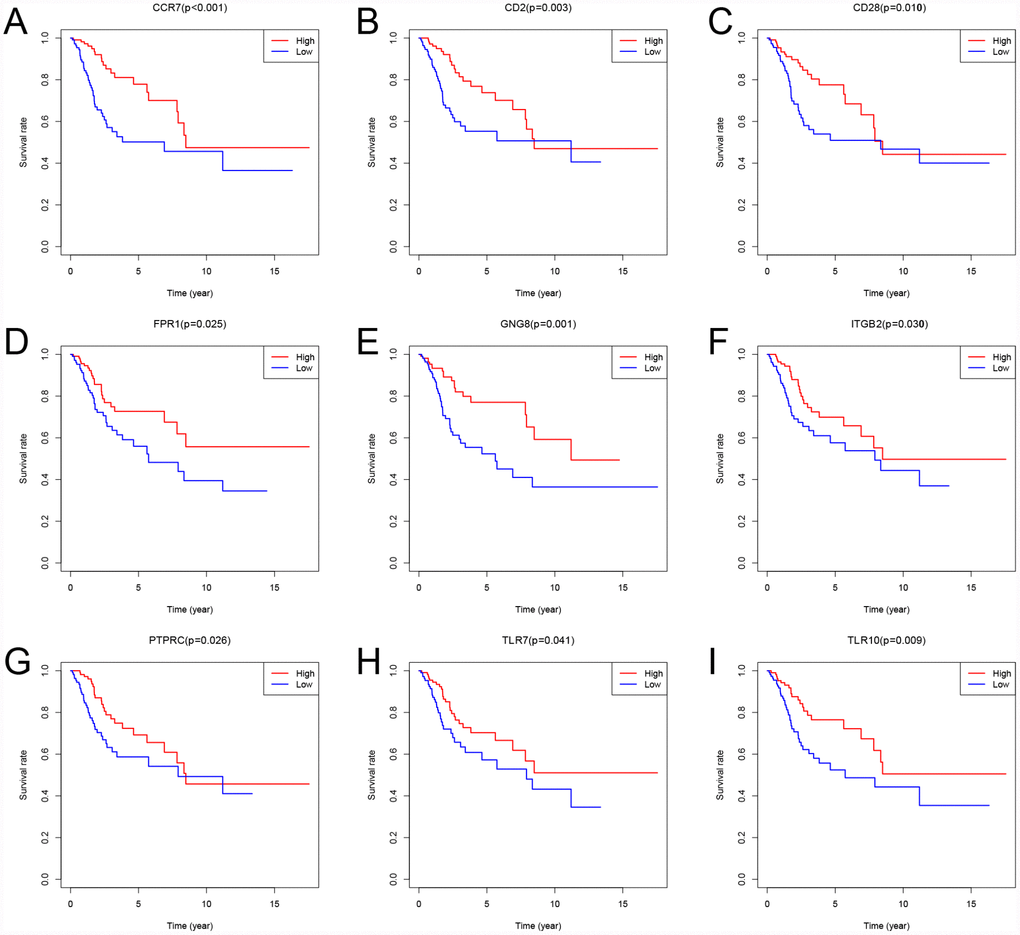
Figure 7.Kaplan-Meier survival curves showing the impact of expression level of 9 random genes with overall survival. Comparison of overall survival in the high (red line) and low (blue line) gene expression groups. P < 0.05 was used to assess differences in Log-rank test.