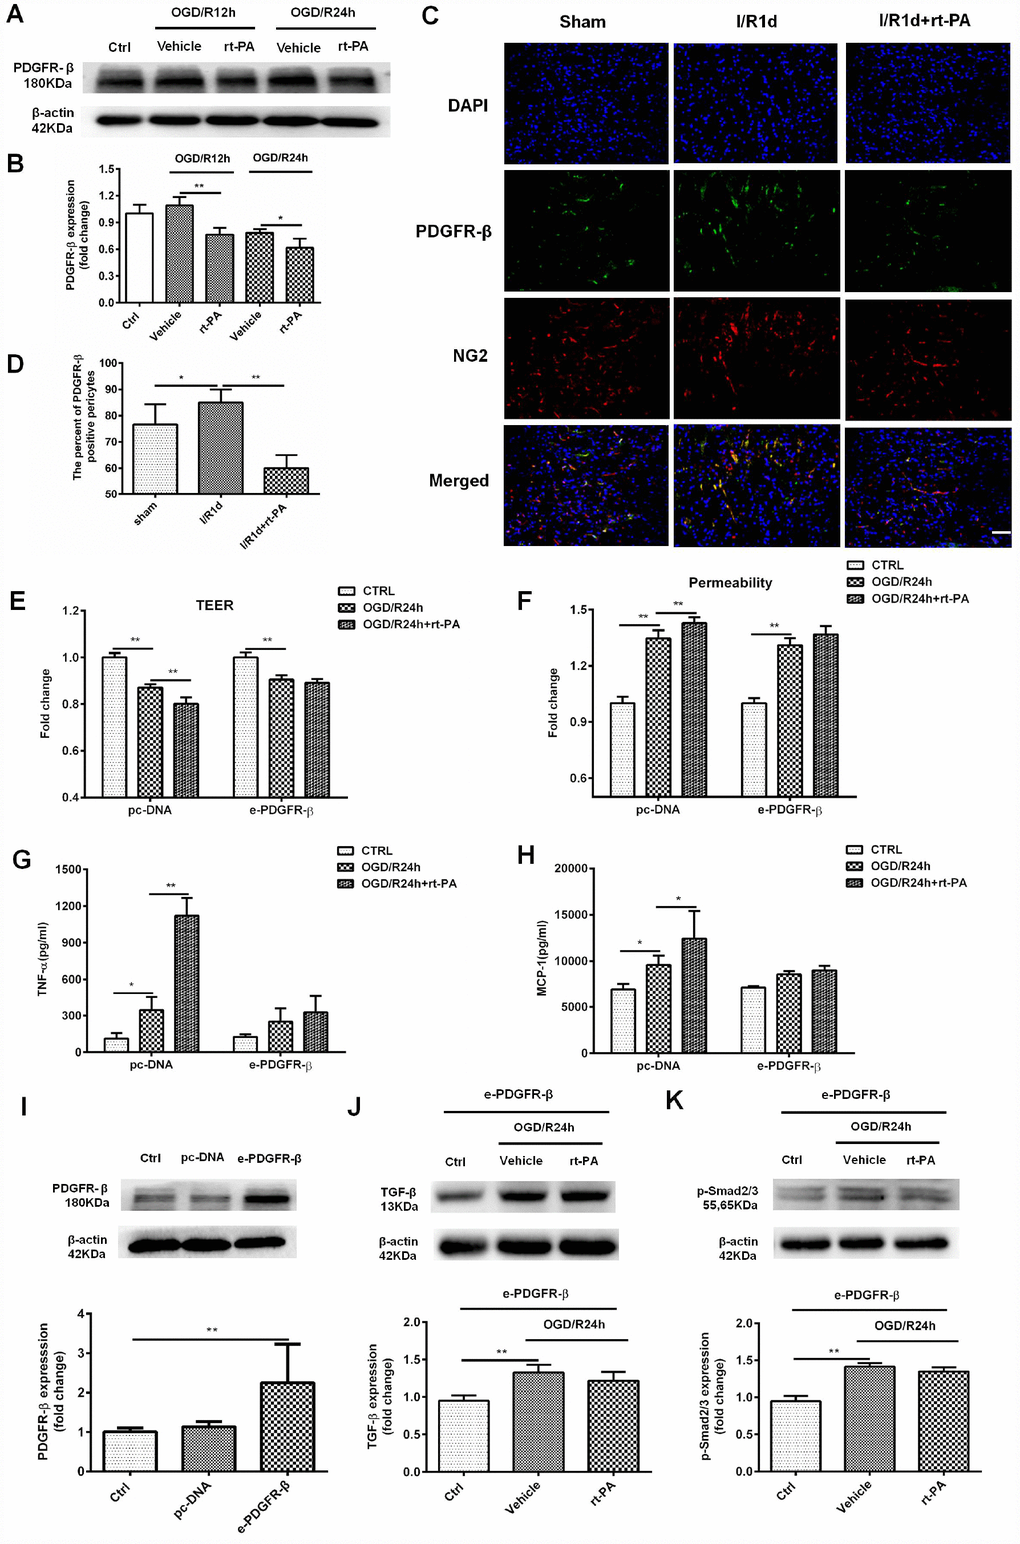
Figure 4.PDGFR-β mediated the disruption of the BBB after rt-PA treatment. (A, B) Representative western blot showing the expression of PDGFR-β 12 h and 24 h after treatment with or without 50 μg/ml rt-PA following OGD for 4 h. Densitometric analysis showing that the level of PDGFR-β protein 12 h and 24 h after treatment with or without rt-PA after OGD for 4 h; n = 3 for each group. Data represent the mean ± sd, *p < 0.05, **p < 0.01. (C, D) Immunofluorescence was used to detect the expression of PDGFR-β in the sham-treated mice and mice treated with or without 9 mg/kg rt-PA 1 d after I/R; scale bar: 50 μm; n = 3 for each group. Data represent the mean ± sd, *p < 0.05, **p < 0.01. (E, F) The TEER and permeability were measured in the pc-DNA- or e-PDGFR-β-transfected pericytes cocultured with endothelial cells alone or in the presence of 50 μg/ml rt-PA 24 h after OGD/R; n = 3–5 for each group. Data represent the mean ± sd, *p < 0.05, **p < 0.01. (G, H) The concentrations of TNF-α and MCP-1 were measured in pc-DNA- or m-PDGFR-β-transfected pericytes cocultured with endothelial cells alone or in the presence of 50 μg/ml rt-PA 24 h after OGD/R; n = 3 for each group. Data represent the mean ± sd, *p < 0.05, **p < 0.01. (I) The expression of PDGFR-β in the control, pc-DNA-, and m-PDGFR-β-transfected pericytes was determined by western blotting; n = 3 for each group. Data represent the mean ± sd, *p < 0.05, **p < 0.01. (J, K) The expression of TGF-β and p-Smad2/3 was measured in PDGFR-β-overexpressing pericytes treated with or without 50 μg/ml rt-PA 24 h after OGD/R; n = 3 for each group. Data represent the mean ± sd, *p < 0.05, **p < 0.01.