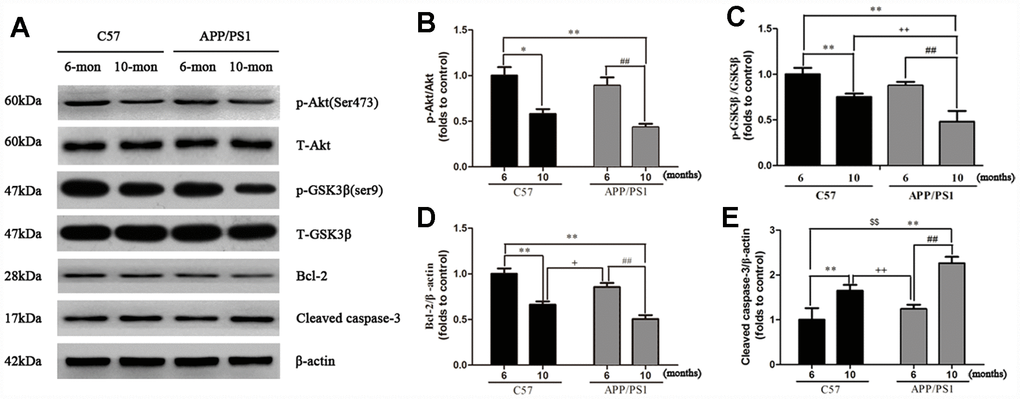
Figure 5.Western blot analysis for p-Akt, p-GSK3β, Bcl-2 and Cleaved caspase-3 in the platelets of APP/PS1 transgenic mice and C57 mice. Band intensities were quantified using Image J software. Each value was calculated on the basis of the data obtained from three independent experiment. Representative bar diagram showing quantitative results for relative levels of (B) p-Akt, (C) p-GSK3β, (D) Bcl-2, (E) Cleaved caspase-3. *P < 0.05 vs. C57 (6 months), **P < 0.01 vs. C57 (6 months), ##P < 0.01 vs. APP/PS1 (6 months), +P < 0.05 vs. C57 (10 months), ++P < 0.01 vs. C57 (10 months).