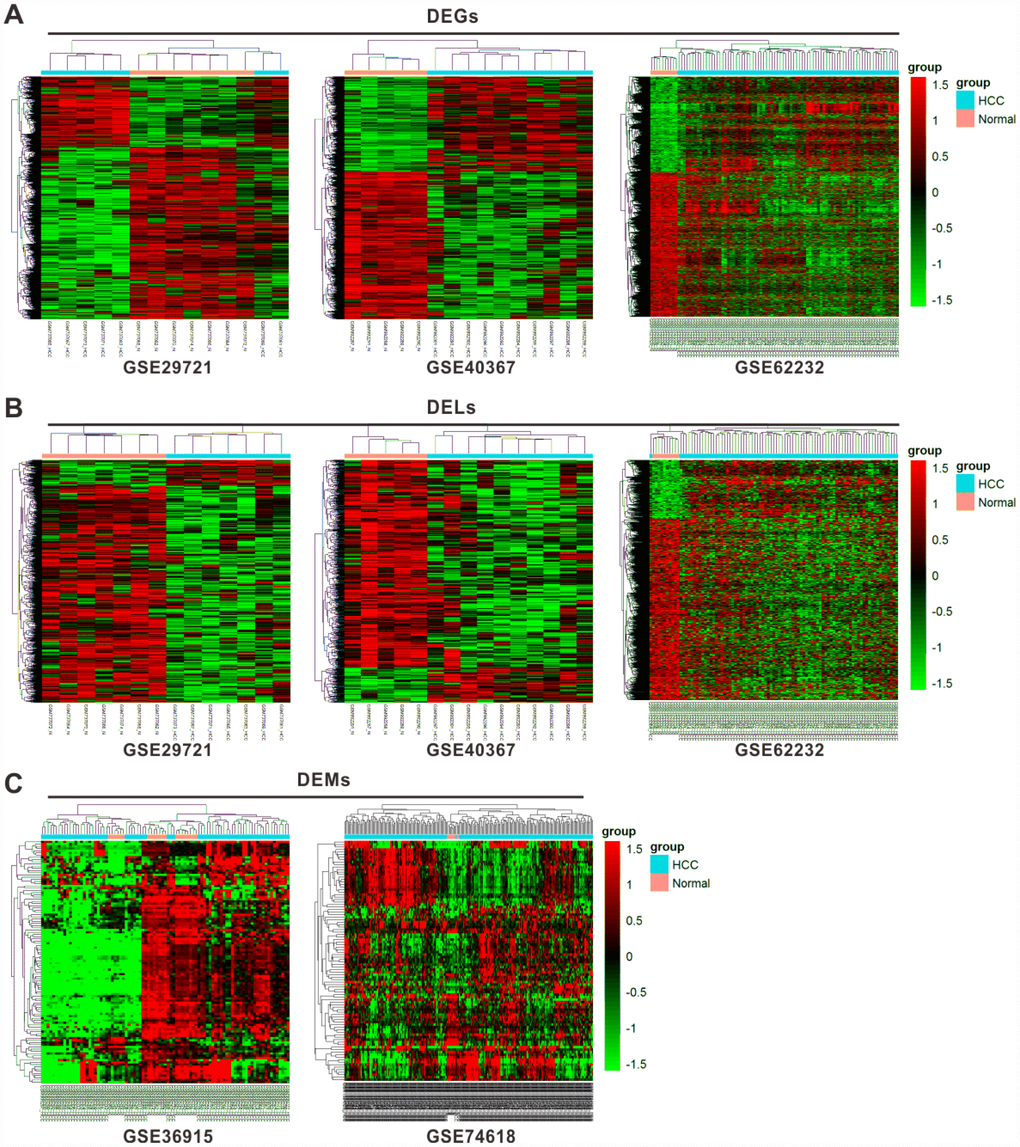
Figure 1.Cluster analysis of differentially expressed profiles. Hierarchical cluster dendrogram of DEGs (A) and DELs (B) identified in GES29721, GSE40367 and GSE62232 as well as DEMs (C) identified in GSE36915 and GSE74618. The rows showed DEGs, DELs, and DEMs, while the columns showed paired samples. The pink part represents normal samples and the blue part represents HCC samples. The left vertical axis shows clusters of DEGs, DELs and DEMs, while the above horizontal axis shows clusters of samples. Red represents high expression and green represents low expression.