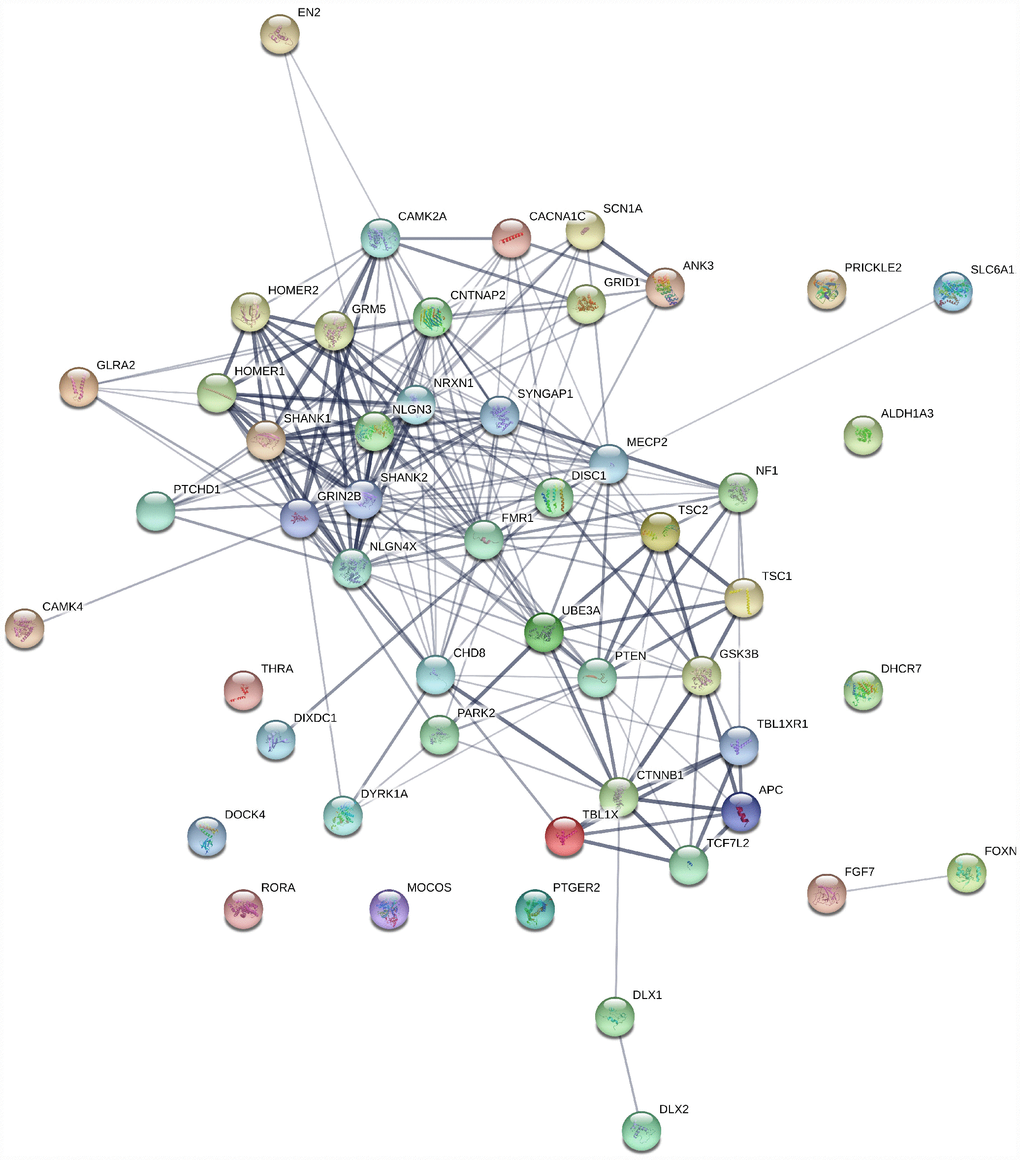
Figure 3.Gene interaction map for ASD genes generated using string1 webserver. Thickness of the line indicates the strength of the interaction between the genes. All sources are used to generate the interaction model with default medium confidence interaction score of 0.4. Ref: https://string-db.org/.