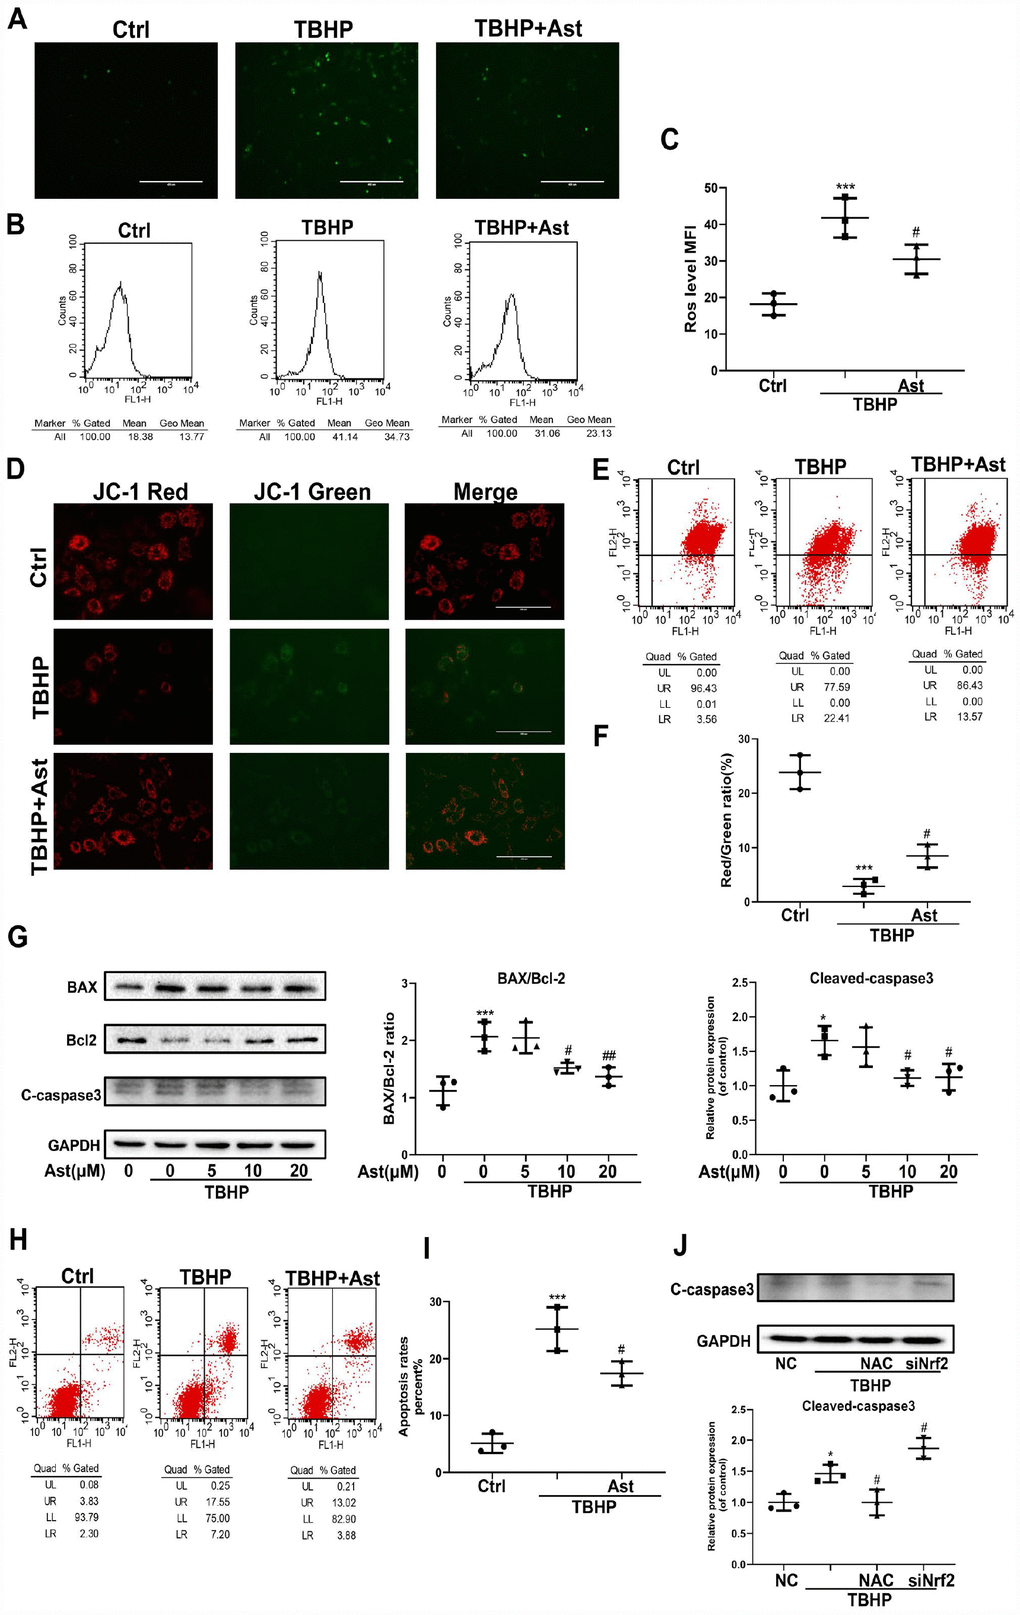
Figure 7.Effects of Ast on TBHP-induced oxidative stress, and chondrocyte apoptosis. Chondrocytes were treated with Ast (10 μM) for 2 h, then stimulated with TBHP (100 μM) for 24 h. The samples with the same concentration of chondrocytes were used to detect intracellular ROS. Intracellular ROS was stained by DCFH-DA followed by fluorescence spectrophotometry and flow cytometric analysis. (A) Green fluorescence indicates that the intracellular ROS production. (B) Representative data of flow cytometric measurement of ROS production. (C) Dot plots graphs show the mean fluorescence intensity (MFI) of ROS in chondrocytes. (D, E) Mitochondrial membrane potential (MMP) was detected by fluorescence and flow cytometric analysis after chondrocytes were incubated with JC-1. Red fluorescence represents JC-1 aggregates in healthy mitochondria, while green fluorescence is emitted by JC-1 monomers, representing MMP dissipation. Merged images exhibit co-localization of JC-1 aggregates and monomers. FL1 represents JC-1 green and FL2 represents JC-1 red. (F) Dot plots graphs represent flow cytometric analysis of MMP levels, represented as the ratio of red/green MFI. (H) To measure chondrocyte apoptosis, cells were stained with Annexin V-FITC/PI and apoptotic cells were counted by flow cytometry. FL1 represents Annexin V-FITC and FL2 represents PI. Apoptosis rates were evaluated, and the results are expressed as dot plots graphs (I). (G) Chondrocytes were treated with vehicle or Ast (5, 10, and 20 μM) for 2 h, then stimulated with TBHP (100 μM) for 24 h. Protein levels of BAX, Bcl-2, and cleaved-caspase3 were examined by western blotting and quantified. (J) Expression of cleaved-caspase 3 protein in chondrocytes under treatment with scrambled siRNA (NC), TBHP (100 μM), N-acetylcysteine (NAC)+TBHP, Nrf2-siRNA+TBHP, respectively. The data are presented as dot plots from three independent experiments. Significant differences among different groups are indicated as *p<0.05 vs. control; **p<0.01 vs. control; ***p<0.001 vs. control. #p < 0.05 vs. TBHP group; ##p < 0.01 vs. TBHP group.