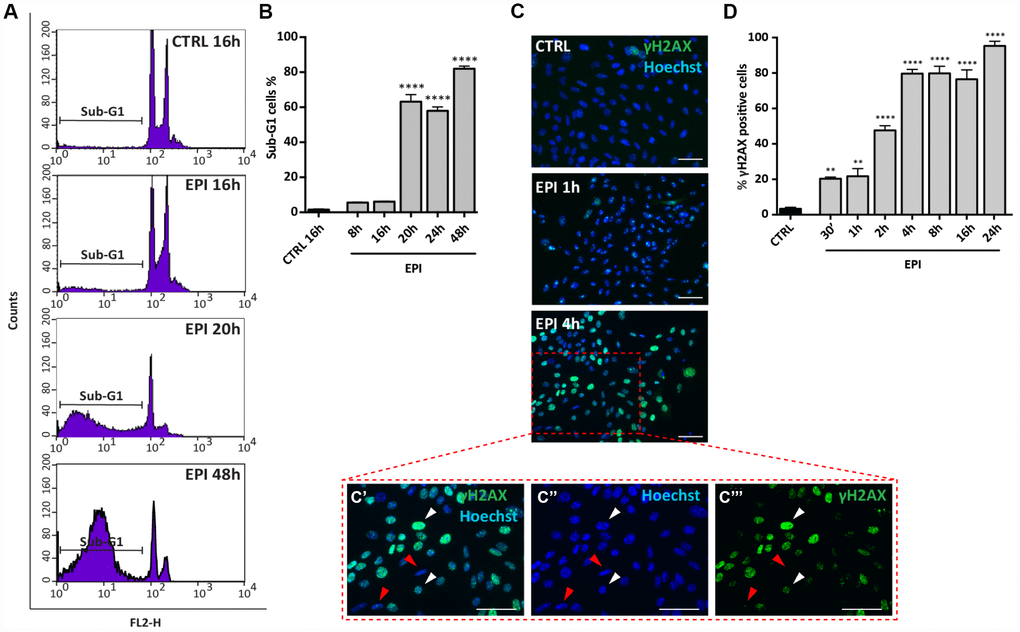
Figure 3.Analysis of EPI-induced apoptosis in ovarian somatic cells. (A, B) Cells treated with 0.5 μm EPI for the indicated times were analyzed by flow cytometry, sub-G1 phase represents apoptotic cells. Data are expressed as mean ± SEM of three different experiments. Statistical differences vs control ****p<0.0001. © Representative IF for γH2AX in the same cells at the indicated times, scale bar = 50 μm. (C’–C’’’ higher magnification images from C). White and red arrowheads indicate γH2AX positive and negative cells, respectively. (D) The graph reports the quantification of γH2AX positive cells percentage scored in three different experiments. Data are expressed as mean ± SEM. Statistical differences vs control **p<0.01 ****p<0.0001.